Model selection and overfitting
Lecture 19
Warm-up
While you wait
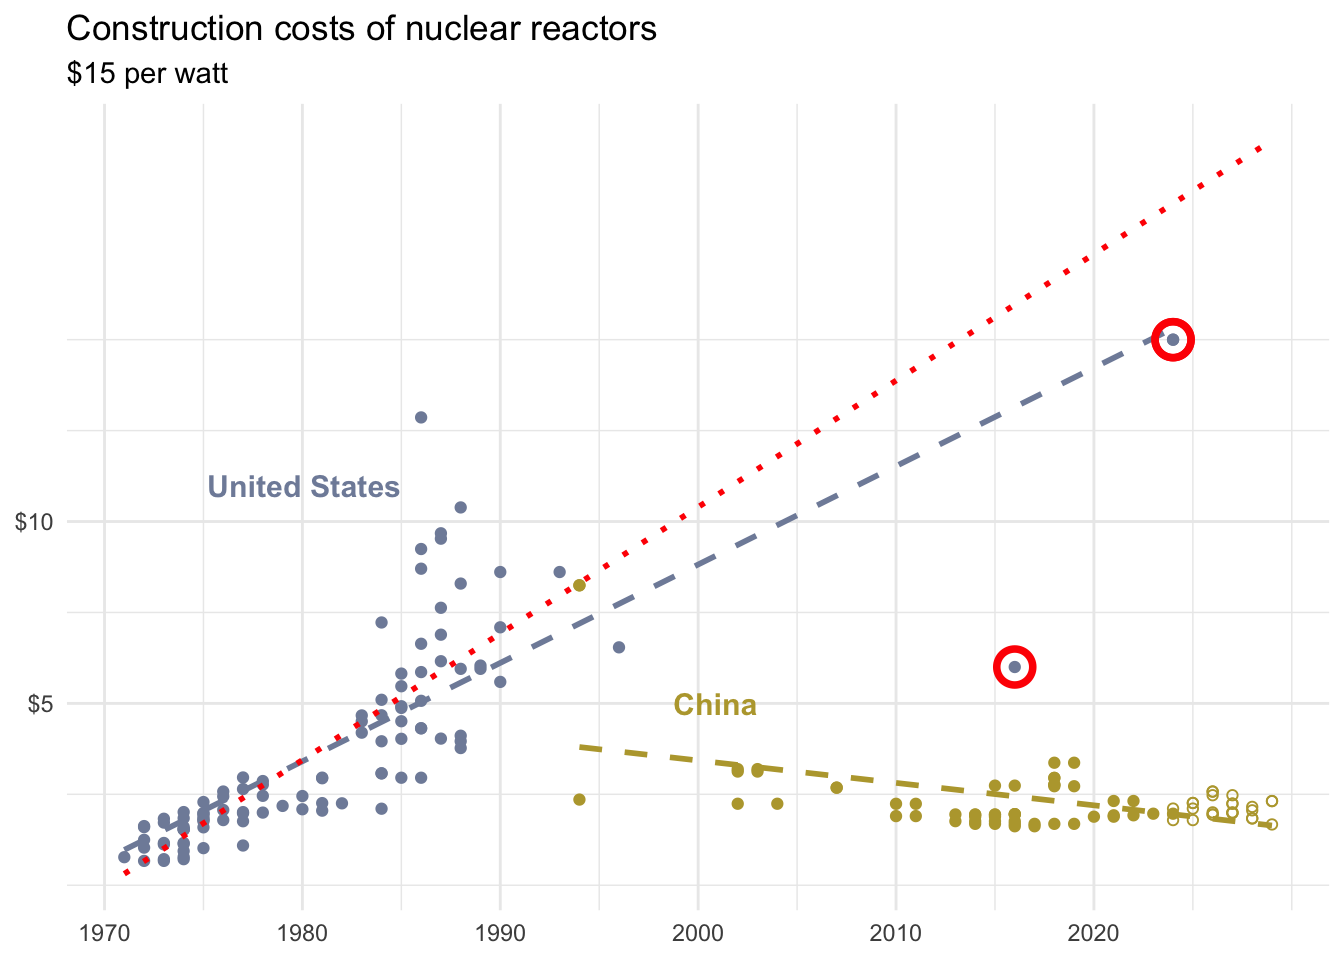
Read the NY Times story

Announcements
Peer eval 2 due tonight at 11:59 pm
Next semester: STA 313 - Advanced Data Visualization - vizdata.org
From last time
ae-12-penguins-model-multi
Go to your ae project in RStudio.
If you haven’t yet done so, make sure all of your changes up to this point are committed and pushed, i.e., there’s nothing left in your Git pane.
If you haven’t yet done so, click Pull to get today’s application exercise file: ae-12-penguins-model-multi.qmd.
Work through the application exercise in class, and render, commit, and push your edits.
What is the difference between \(R^2\) and adjusted \(R^2\)?
-
\(R^2\):
- Proportion of variability in the outcome explained by the model.
- Useful for quantifying the fit of a given model.
- Adjusted \(R^2\):
- Proportion of variability in the outcome explained by the model, with a penalty added for the number of predictors in the model.
- Useful for comparing models.
Using adjusted \(R^2\) to compare models
Fit two (or more) models to the same data set with different sets of predictors, selected based on subject-matter knowledge and/or exploratory data analysis results, compared their adjusted \(R^2\) values, and selected the model with the highest adjusted \(R^2\) value.
-
Perform stepwise selection (forward or backward) to select a model that maximizes adjusted \(R^2\):
- Backward elimination: Start with a model that includes all candidate predictors, and iteratively remove the predictor that results in the largest increase in adjusted \(R^2\) until no further improvement is observed.
- Forward selection: Start with a model that includes no predictors, and iteratively add the predictor that results in the largest increase in adjusted \(R^2\) until no further improvement is observed.
Using other criteria to compare models
Same model selection approaches (subject-matter knowledge, stepwise selection) can be used with various model comparison criteria, such as:
- Maximize adjusted \(R^2\)
- Minimize Akaike Information Criterion (AIC)
- Minimize Bayesian Information Criterion (BIC)
- …
Note
Only mentioning criteria other than adjusted \(R^2\) here to build awareness that other criteria exist. We will not cover all of them in detail in this course (and this is not even a complete list), but you will encounter them in higher-level modeling courses and in practice.
Balancing fit and complexity
More complex models (i.e., models with more predictors) tend to fit the data at hand better, but may not generalize well to new data.
Model selection criteria, like adjusted \(R^2\), help balance model fit and complexity to avoid overfitting by penalizing models with more predictors.
Overfitting
Overfitting occurs when a model captures not only the underlying relationship between predictors and outcome but also the random noise in the data.
-
Overfitted models tend to perform well on the observed data but poorly on new, unseen data.
- Good news: We have techniques to detect and prevent overfitting.
- Bad news: We won’t get into those until next week.
- For today, we’ll discuss one feature of data that can lead to overfitting – outliers.
Outliers
Outliers in regression
Outliers are observations that fall far from the main cloud of points.
-
They can be outlying in:
- the \(x\) direction,
- the \(y\) direction, or
- both.
However, being outlying in a univariate sense does not always mean being outlying from the bivariate model.
Points that are in-line with the bivariate model usually do not influence the least squares line, even if they are extreme in \(x\), \(y\), or both.
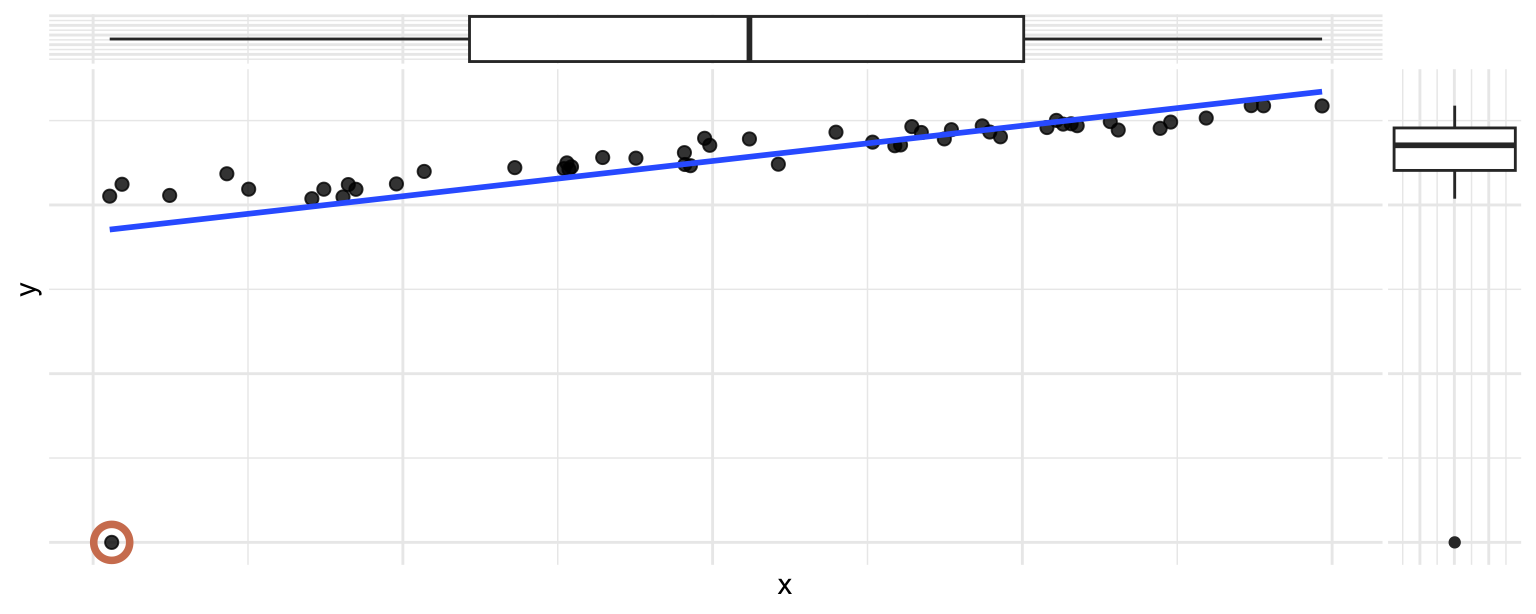
Participate 📱💻
Which of the following best describes the circled point?
- It’s an outlier in \(x\) only
- It’s an outlier in \(y\) only
- It’s an outlier in both \(x\) and \(y\) and influences the regression line
- It’s an outlier in both \(x\) and \(y\) but does not influence the regression line

Scan the QR code or go to app.wooclap.com/sta199. Log in with your Duke NetID.
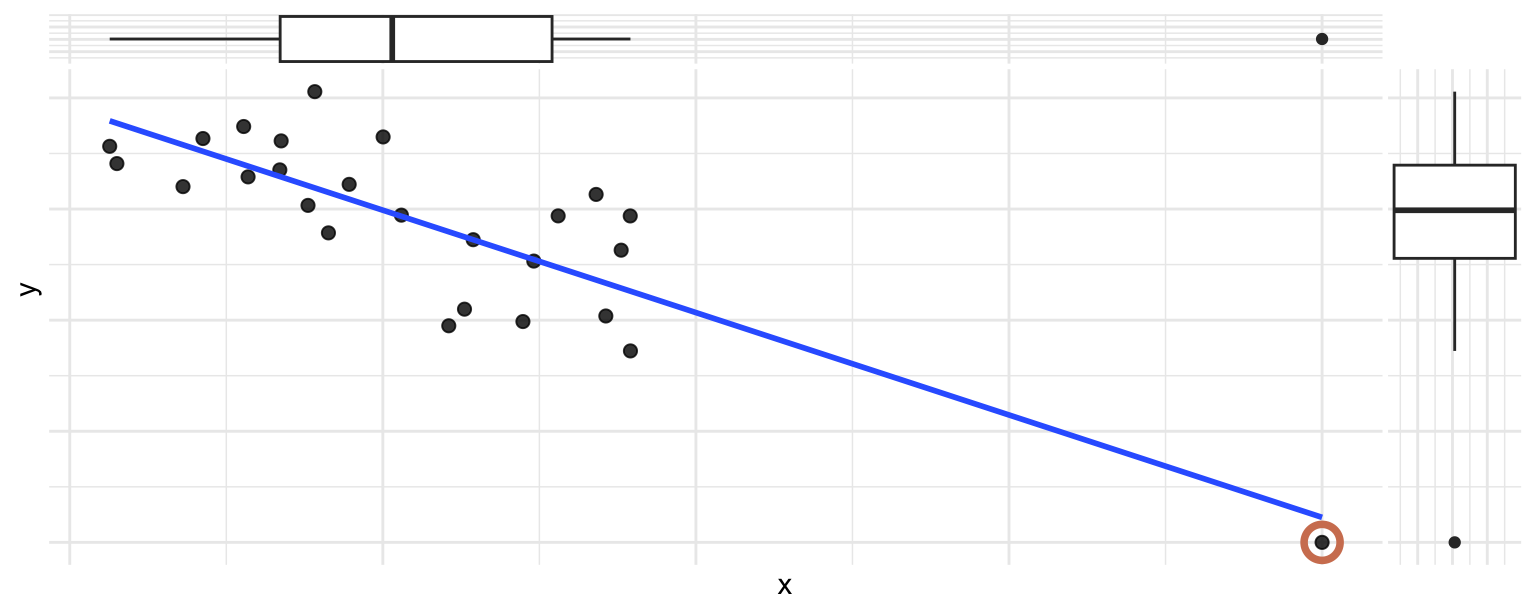
Participate 📱💻
Which of the following best describes the circled point?
- It’s an outlier in \(x\) only and influences the regression line
- It’s an outlier in \(x\) only but does not influence the regression line
- It’s an outlier in \(y\) only and influences the regression line
- It’s an outlier in \(y\) only but does not influence the regression line
Scan the QR code or go to app.wooclap.com/sta199. Log in with your Duke NetID.
Types of outliers
Outliers: Points or groups of points that stand out from the rest of the data.
Leverage points: Points that fall horizontally away from the center of the cloud tend to pull harder on the line, so we call them points with high leverage or leverage points.
-
Influential points: Outliers, generally high leverage points, that actually alter the slope or position of the regression line.
- We say a point is influential if omitting it would substantially change the regression model.
Practical advice
Test your analysis with and without outliers.
Compare and discuss the impact of outliers on model fit.
Present both models to stakeholders to choose the most reasonable interpretation.
. . .
Warning
Removing outliers should only be done with strong justification – excluding interesting or extreme cases can lead to misleading models, poor predictive performance, and flawed conclusions.
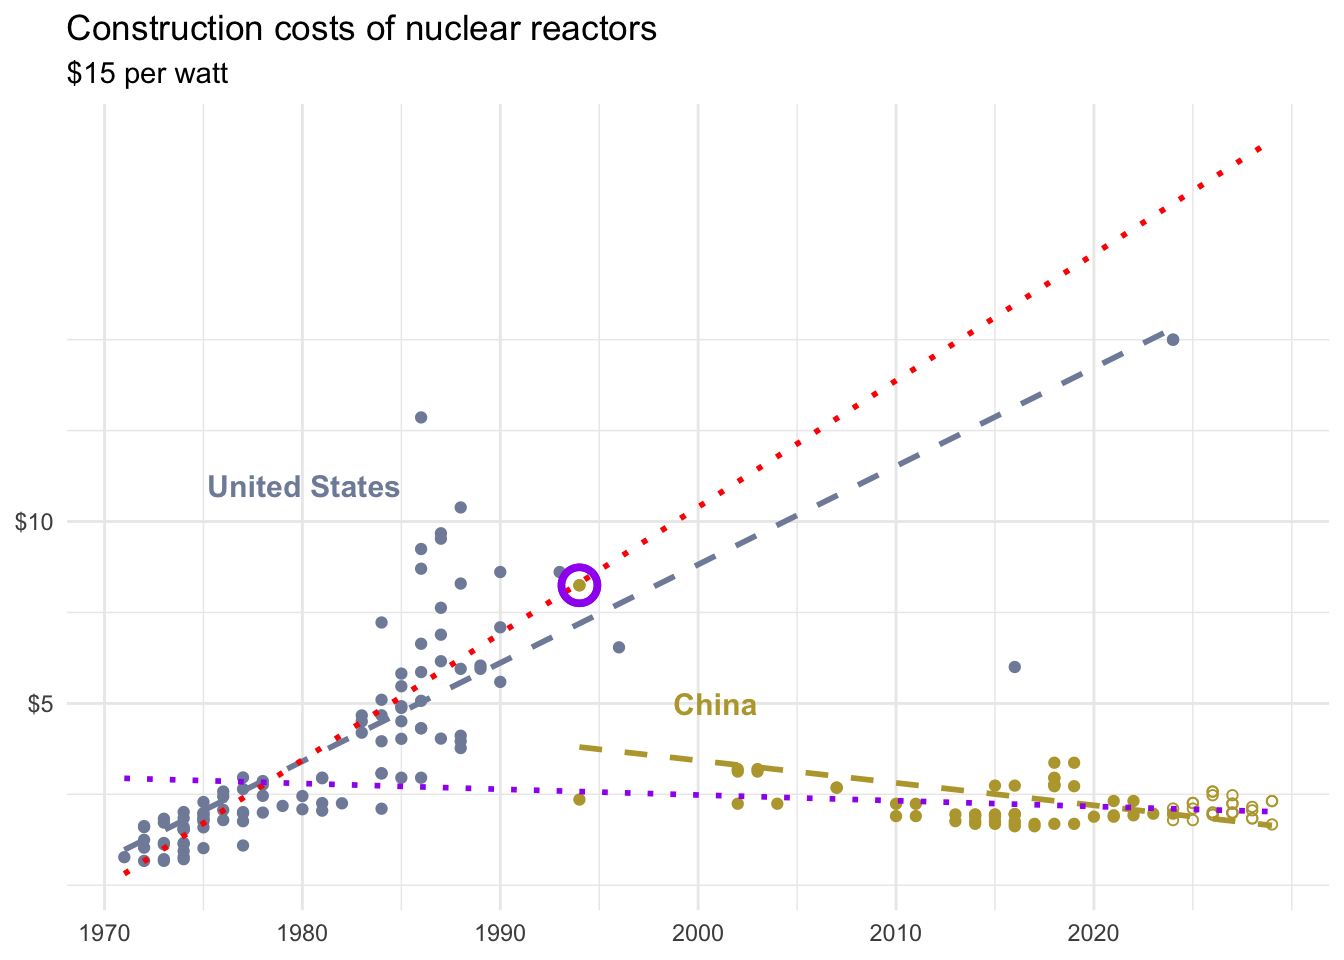
From the NYTimes
How China Raced Ahead of the U.S. on Nuclear Power
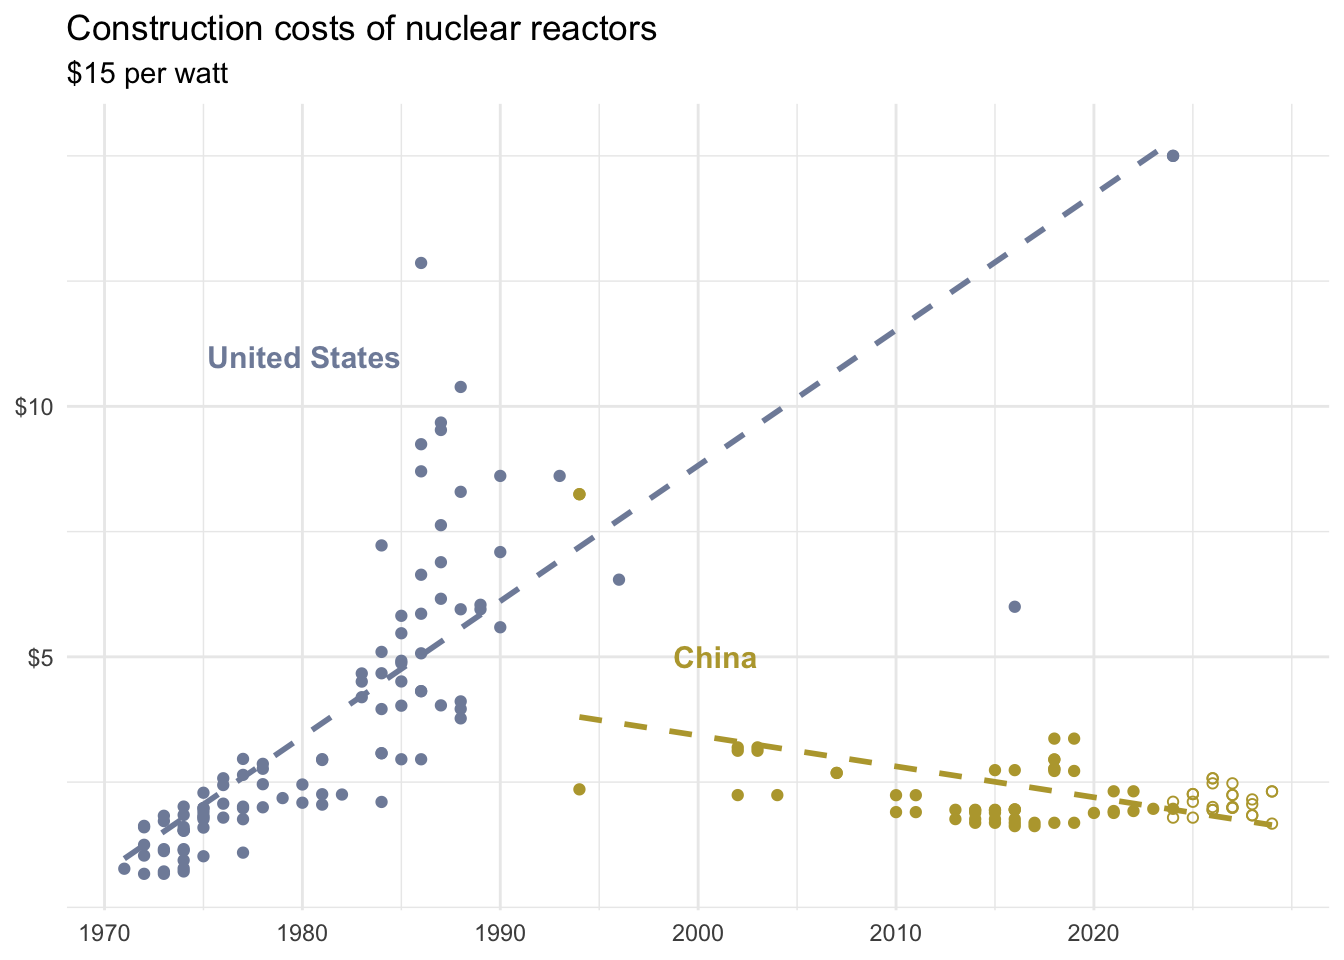
US without outliers
China without outliers