Model selection and overfitting
Lecture 19
October 30, 2025
While you wait
Read the NY Times story

Participate 📱💻
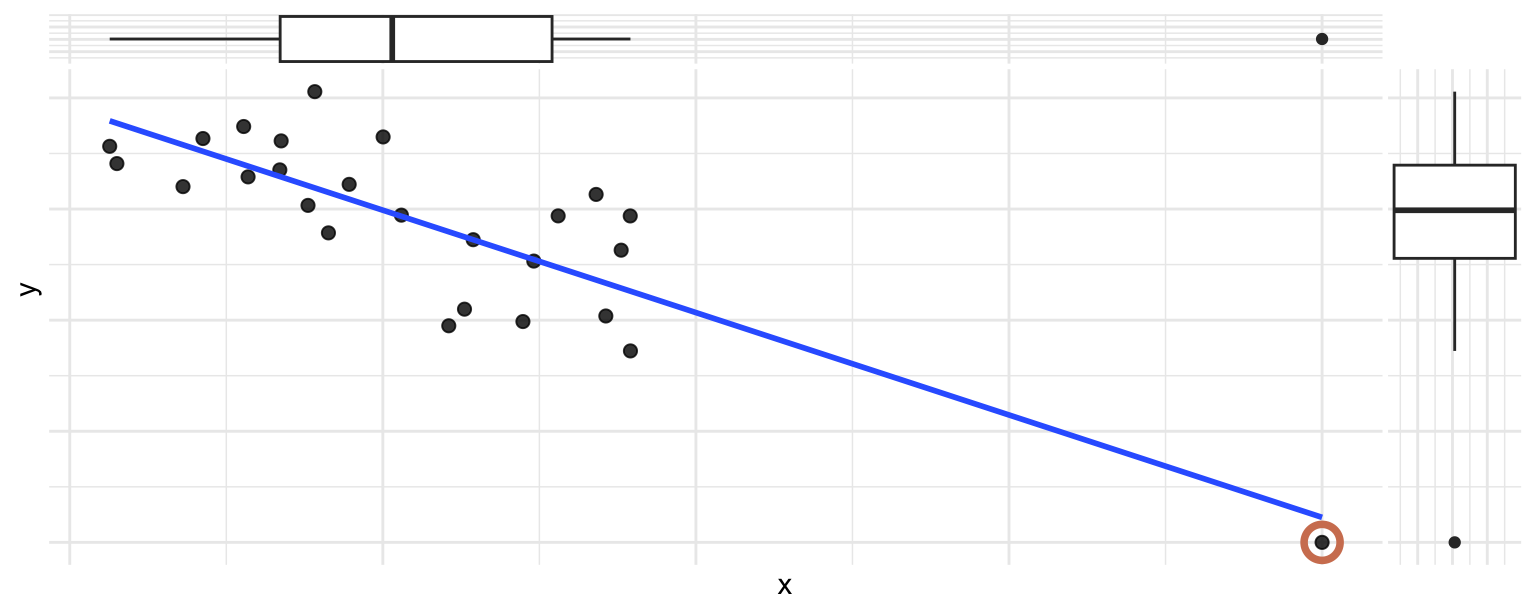
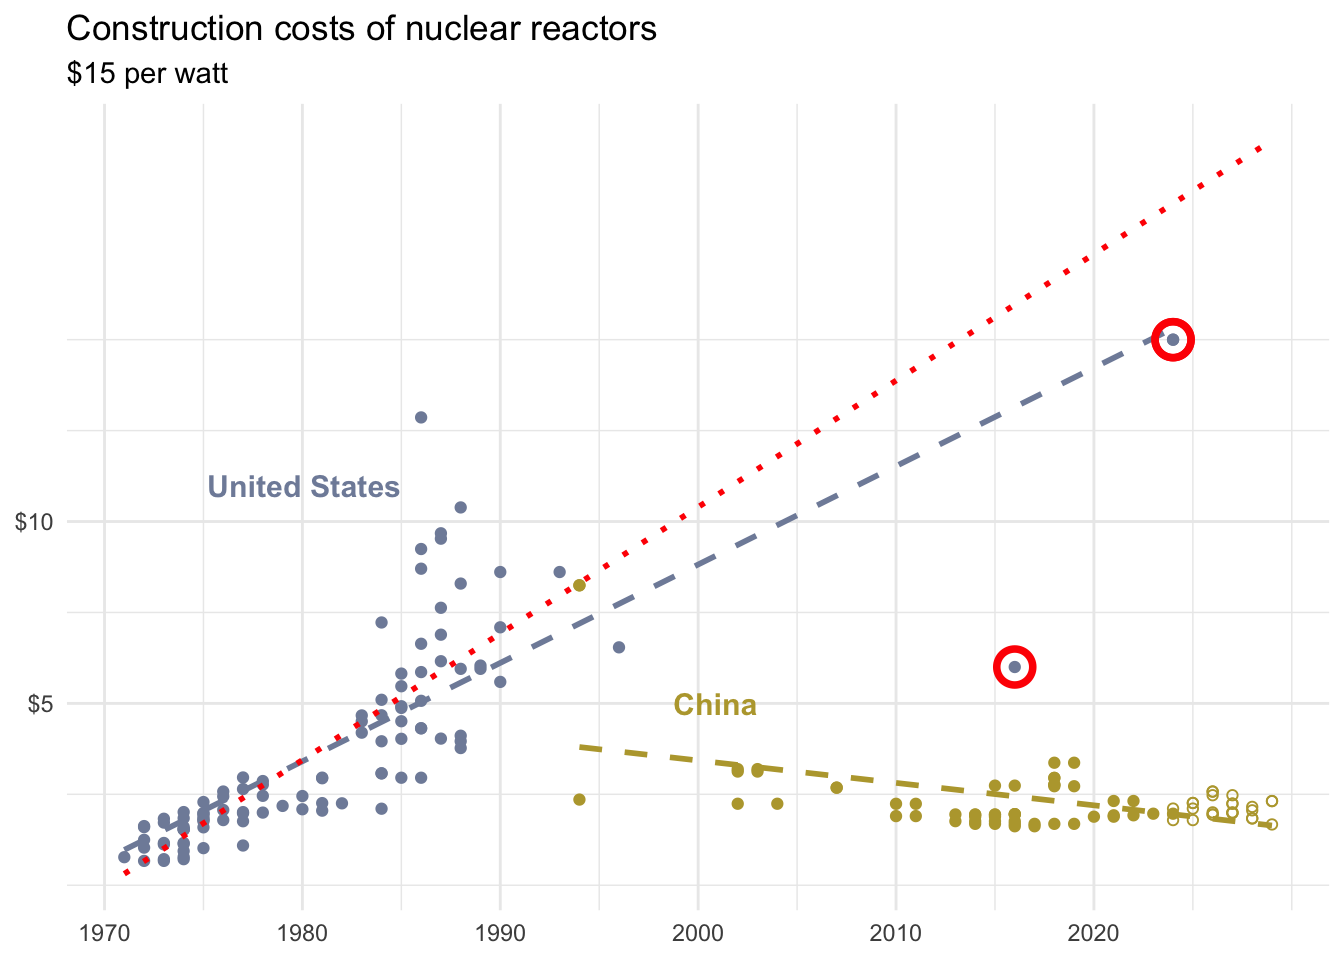
Which of the following best describes the circled point?
- It’s an outlier in \(x\) only
- It’s an outlier in \(y\) only
- It’s an outlier in both \(x\) and \(y\) and influences the regression line
- It’s an outlier in both \(x\) and \(y\) but does not influence the regression line

Scan the QR code or go to app.wooclap.com/sta199. Log in with your Duke NetID.
Participate 📱💻
Which of the following best describes the circled point?
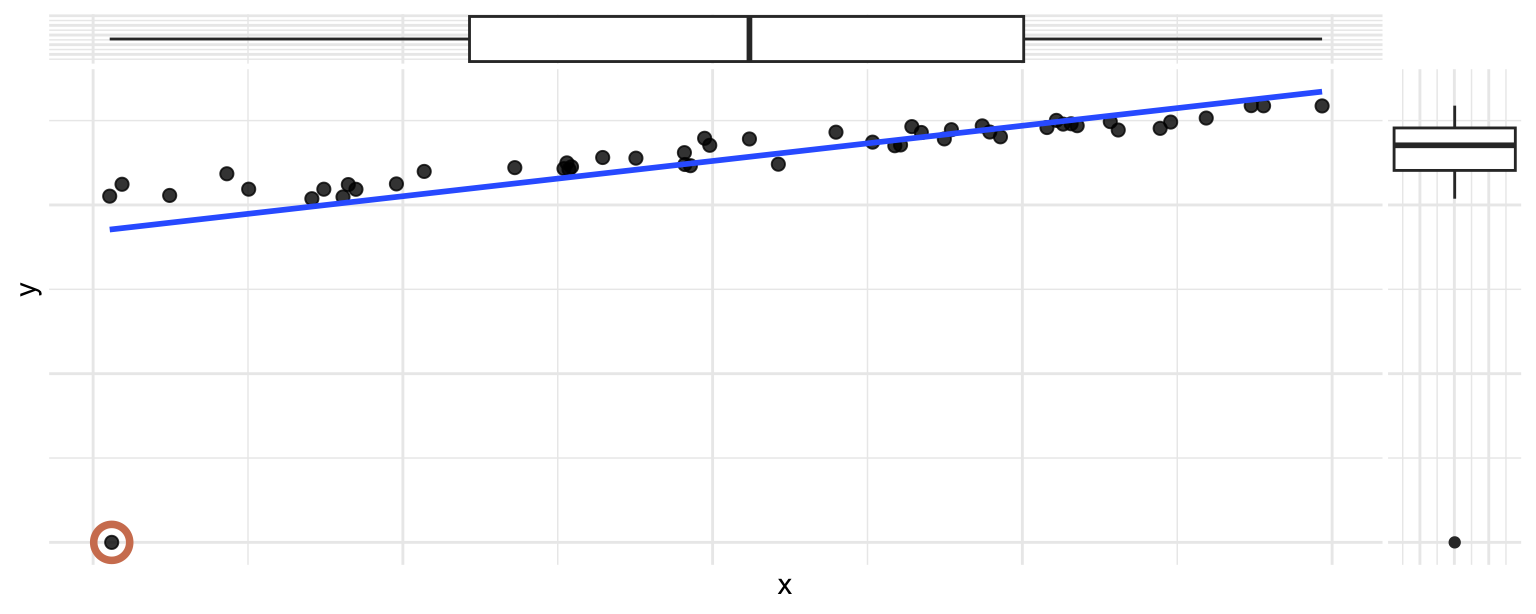
- It’s an outlier in \(x\) only and influences the regression line
- It’s an outlier in \(x\) only but does not influence the regression line
- It’s an outlier in \(y\) only and influences the regression line
- It’s an outlier in \(y\) only but does not influence the regression line
Scan the QR code or go to app.wooclap.com/sta199. Log in with your Duke NetID.
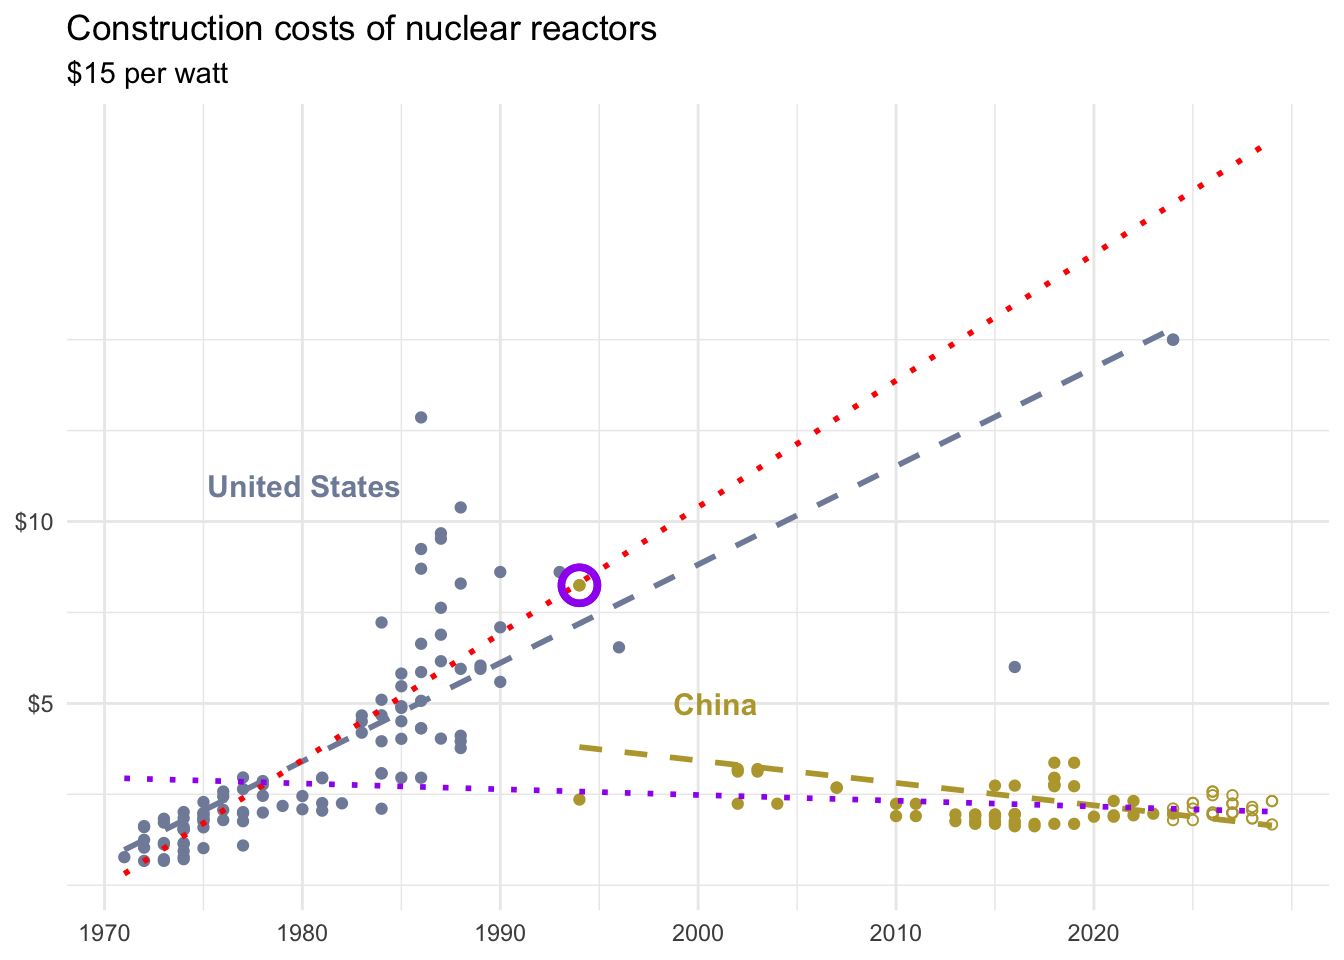
From the NYTimes
How China Raced Ahead of the U.S. on Nuclear Power
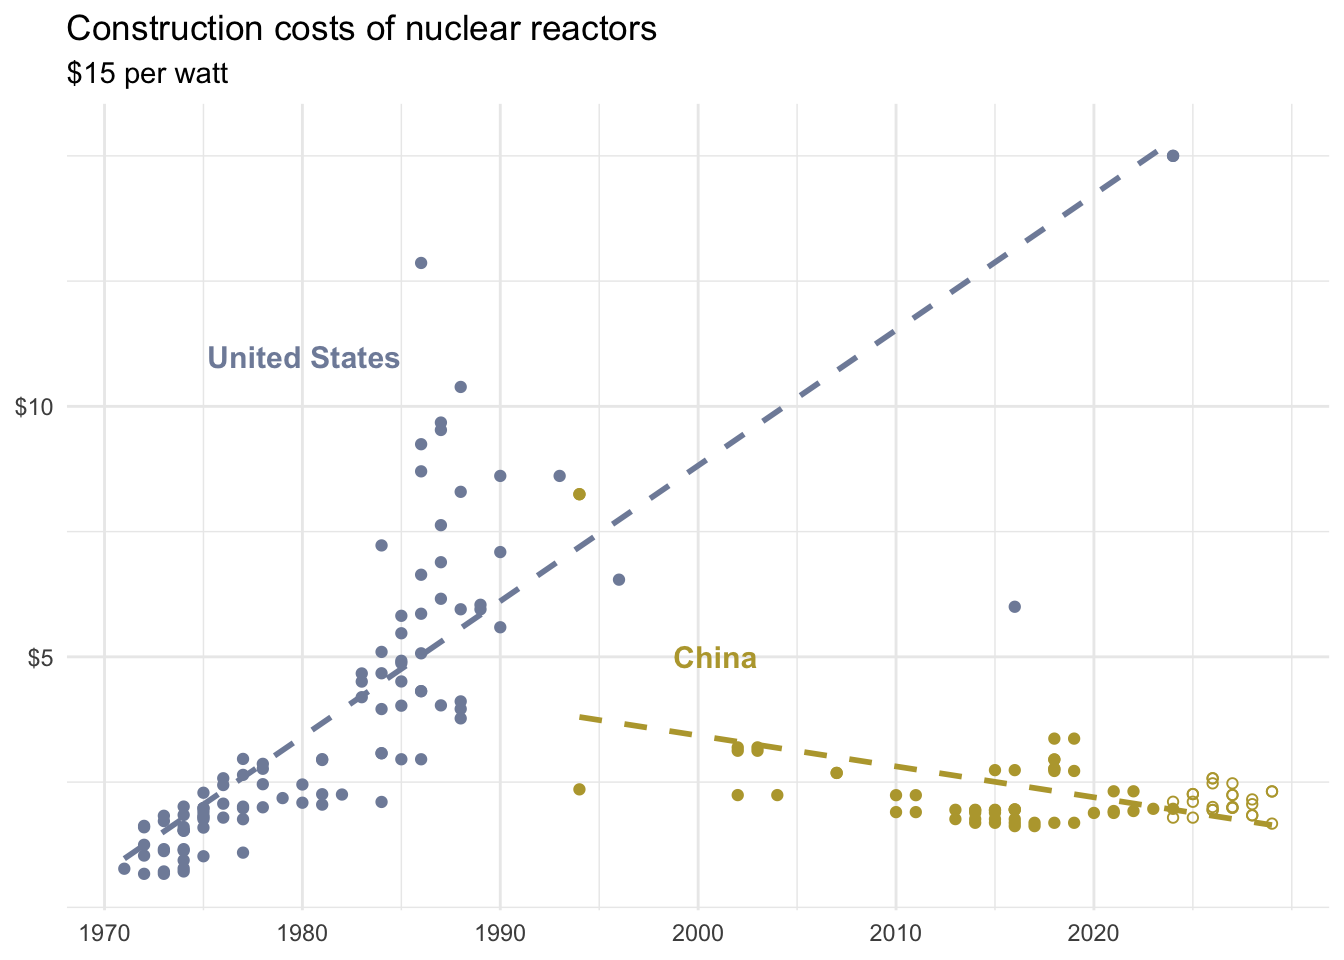
US without outliers
China without outliers