Importing and recoding data
Lecture 10
Warm-up
While you wait: Participate 📱💻
Did you get my Week 5 nudge email?
- Yes, I did! And I don’t have any questions.
- Yes, I did! And I have questions.
- I haven’t checked my email today yet, I will do so after class.
- What, you email us?!

Scan the QR code or go to app.wooclap.com/sta199. Log in with your Duke NetID.
Announcements
Week 5 nudges
Wooclap scores on Gradebook on Canvas
-
Start thinking about your project teams:
- Teams of 3-4 people from your lab section
- Fill out the project team form (link on Friday’s weekly recap email) or let your TA know of your team preferences by the end of lab on Monday
- After that, we’ll assign teams for you
From last time
Finish up: ae-08-durham-climate-factors
Go to your ae project in RStudio.
Open
ae-08-durham-climate-factors.qmdand pick up at “Pivot”.
Reading data into R
Reading rectangular data
- Using readr:
- Most commonly:
read_csv() - Maybe also:
read_tsv(),read_delim(), etc.
- Most commonly:
. . .
- Using readxl:
read_excel()
. . .
- Using googlesheets4:
read_sheet()– We haven’t covered this in the videos, but might be useful for your projects
Application exercise
Reading Excel files
Read an Excel file, with all its Excel-ness
Split it into subsets based on features of the data
Write out subsets as CSV files
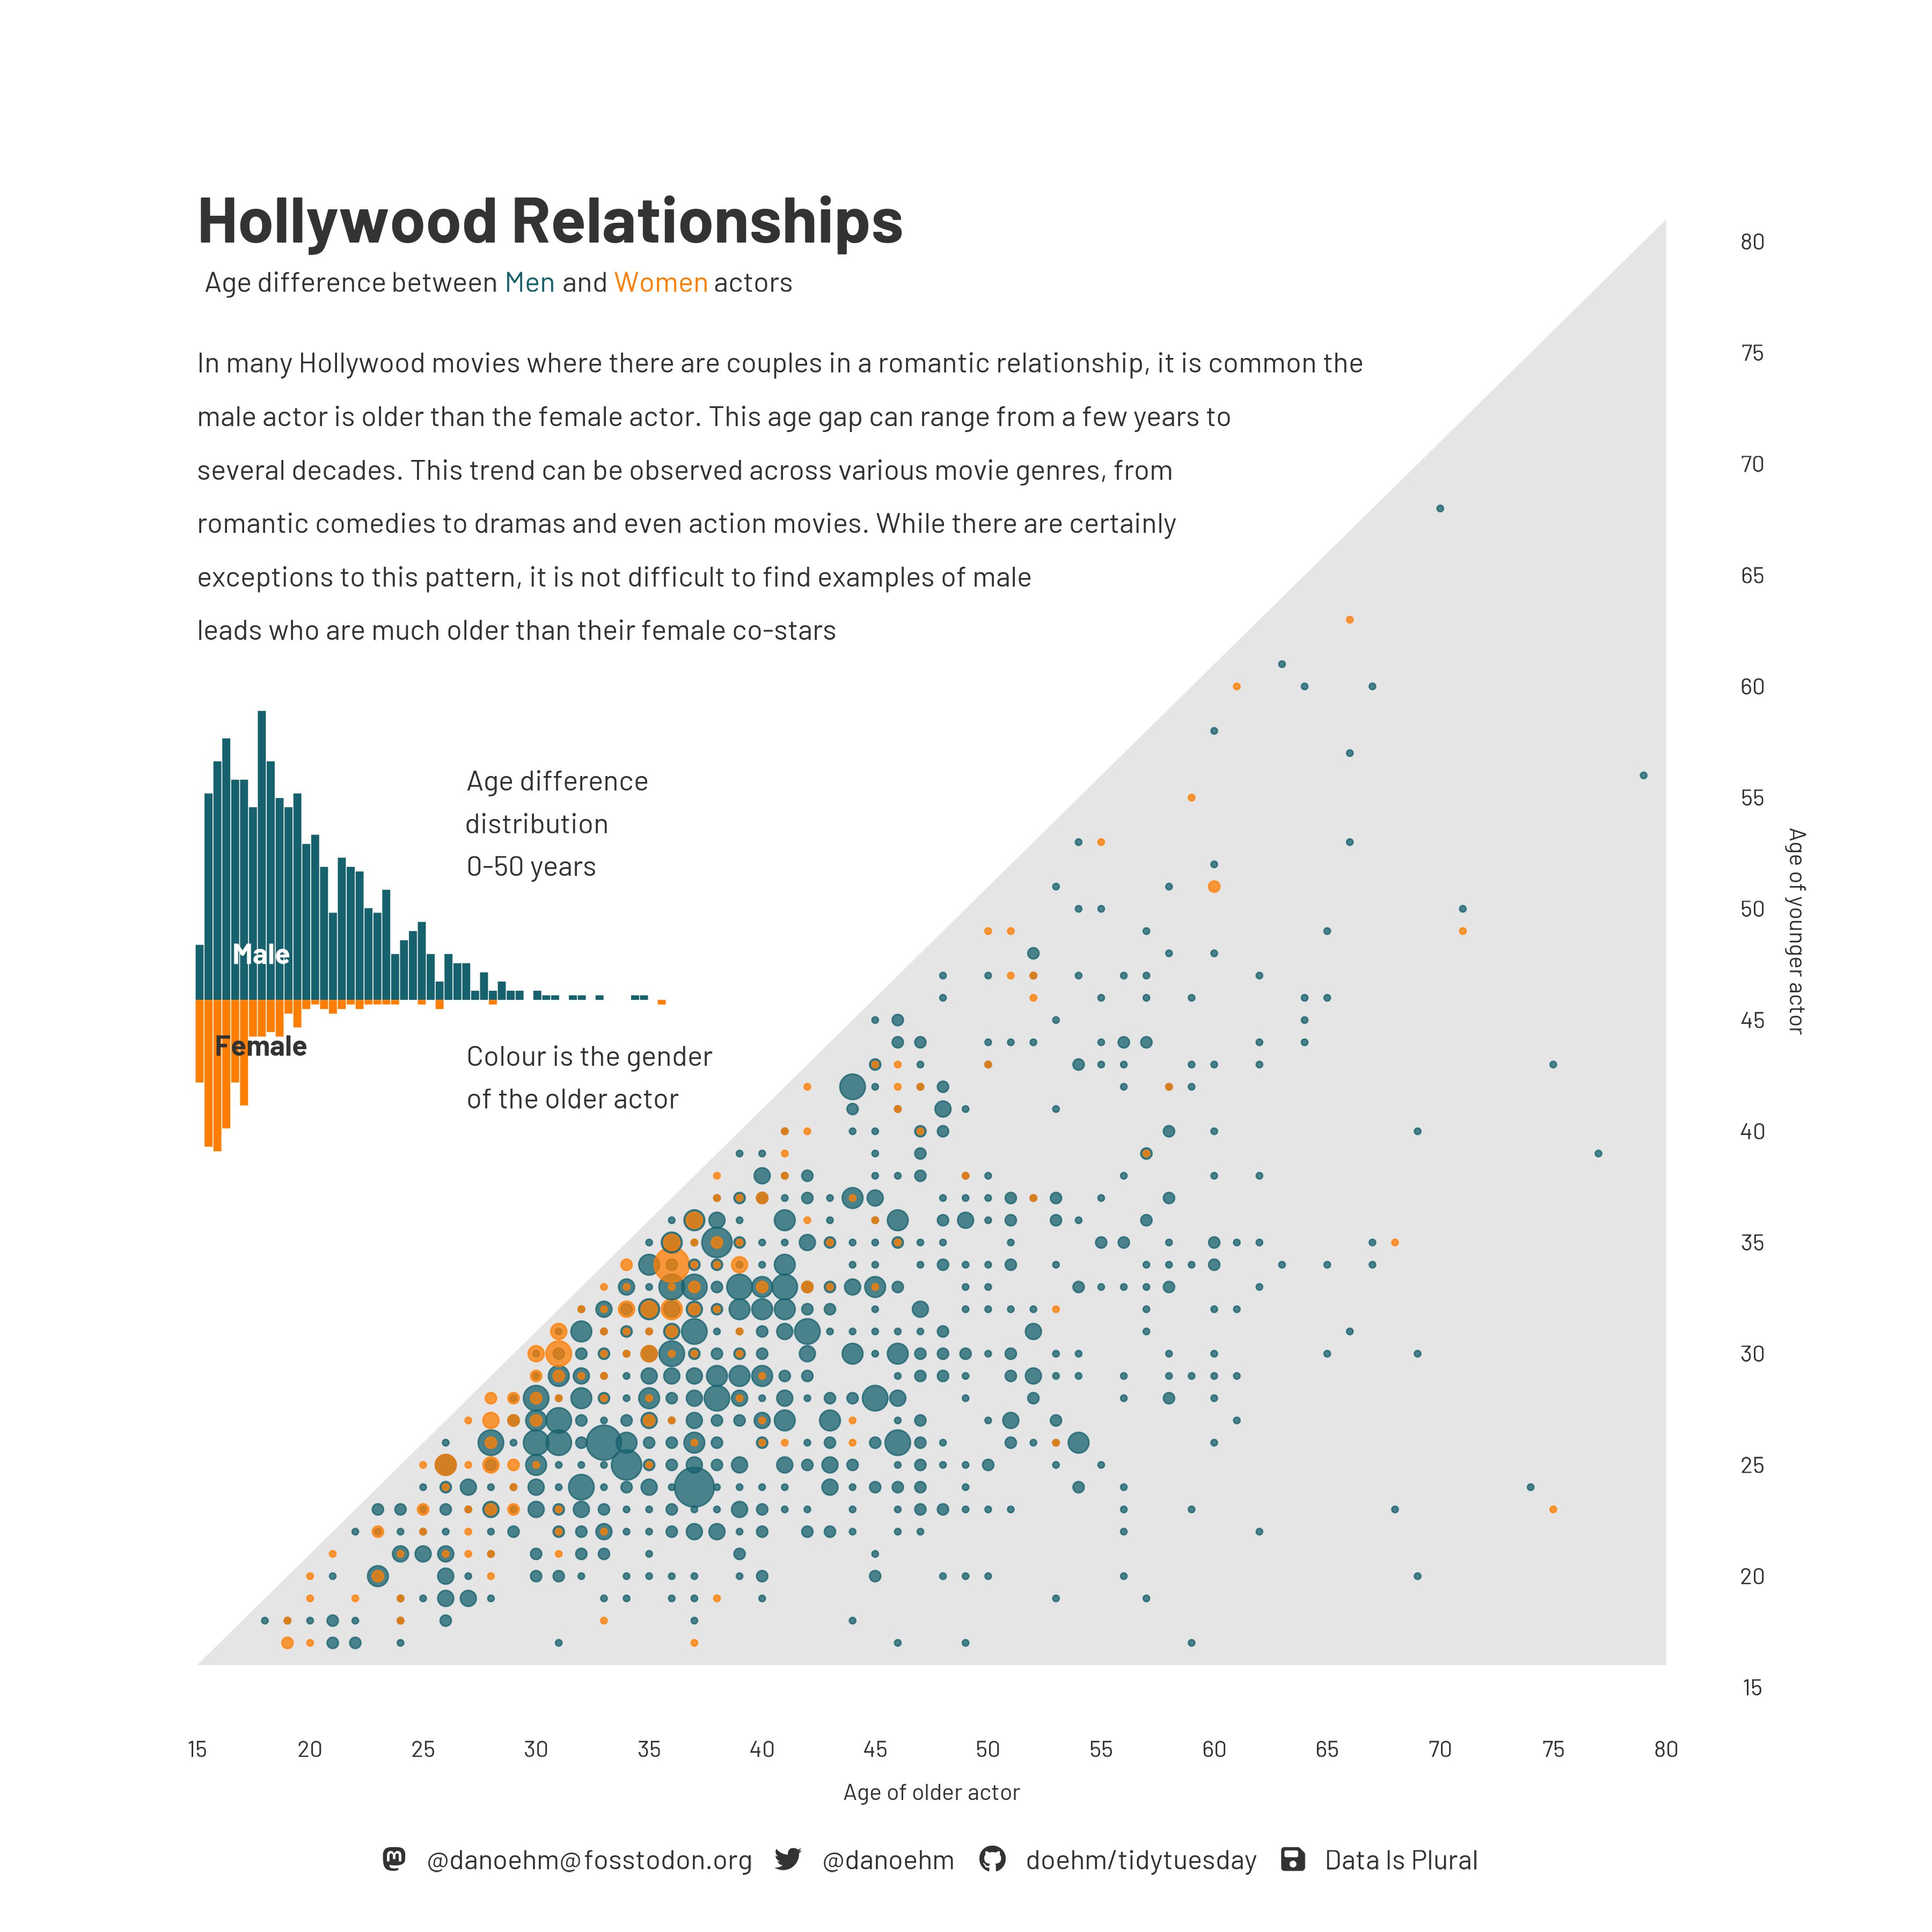
Age gap in Hollywood relationships
Identify and articulate one feature of the data based on this visualization.
ae-08-age-gaps-import
Go to your ae project in RStudio.
If you haven’t yet done so, make sure all of your changes up to this point are committed and pushed, i.e., there’s nothing left in your Git pane.
If you haven’t yet done so, click Pull to get today’s application exercise file: ae-08-age-gaps-import.qmd.
Work through the application exercise in class, and render, commit, and push your edits.