Importing and recoding data

Lecture 10

Dr. Mine Çetinkaya-Rundel

Duke University
STA 199 - Fall 2025

September 25, 2025

Warm-up

While you wait: Participate 📱💻

Did you get my Week 5 nudge email?

  • Yes, I did! And I don’t have any questions.
  • Yes, I did! And I have questions.
  • I haven’t checked my email today yet, I will do so after class.
  • What, you email us?!

Scan the QR code or go to app.wooclap.com/sta199. Log in with your Duke NetID.

Announcements

  • Week 5 nudges

  • Wooclap scores on Gradebook on Canvas

  • Start thinking about your project teams:

    • Teams of 3-4 people from your lab section
    • Fill out the project team form (link on Friday’s weekly recap email) or let your TA know of your team preferences by the end of lab on Monday
    • After that, we’ll assign teams for you

From last time

Finish up: ae-08-durham-climate-factors

  • Go to your ae project in RStudio.

  • Open ae-08-durham-climate-factors.qmd and pick up at “Pivot”.

Reading data into R

Reading rectangular data

  • Using readr:
    • Most commonly: read_csv()
    • Maybe also: read_tsv(), read_delim(), etc.
  • Using googlesheets4: read_sheet() – We haven’t covered this in the videos, but might be useful for your projects

Application exercise

Reading Excel files

  • Read an Excel file, with all its Excel-ness

  • Split it into subsets based on features of the data

  • Write out subsets as CSV files

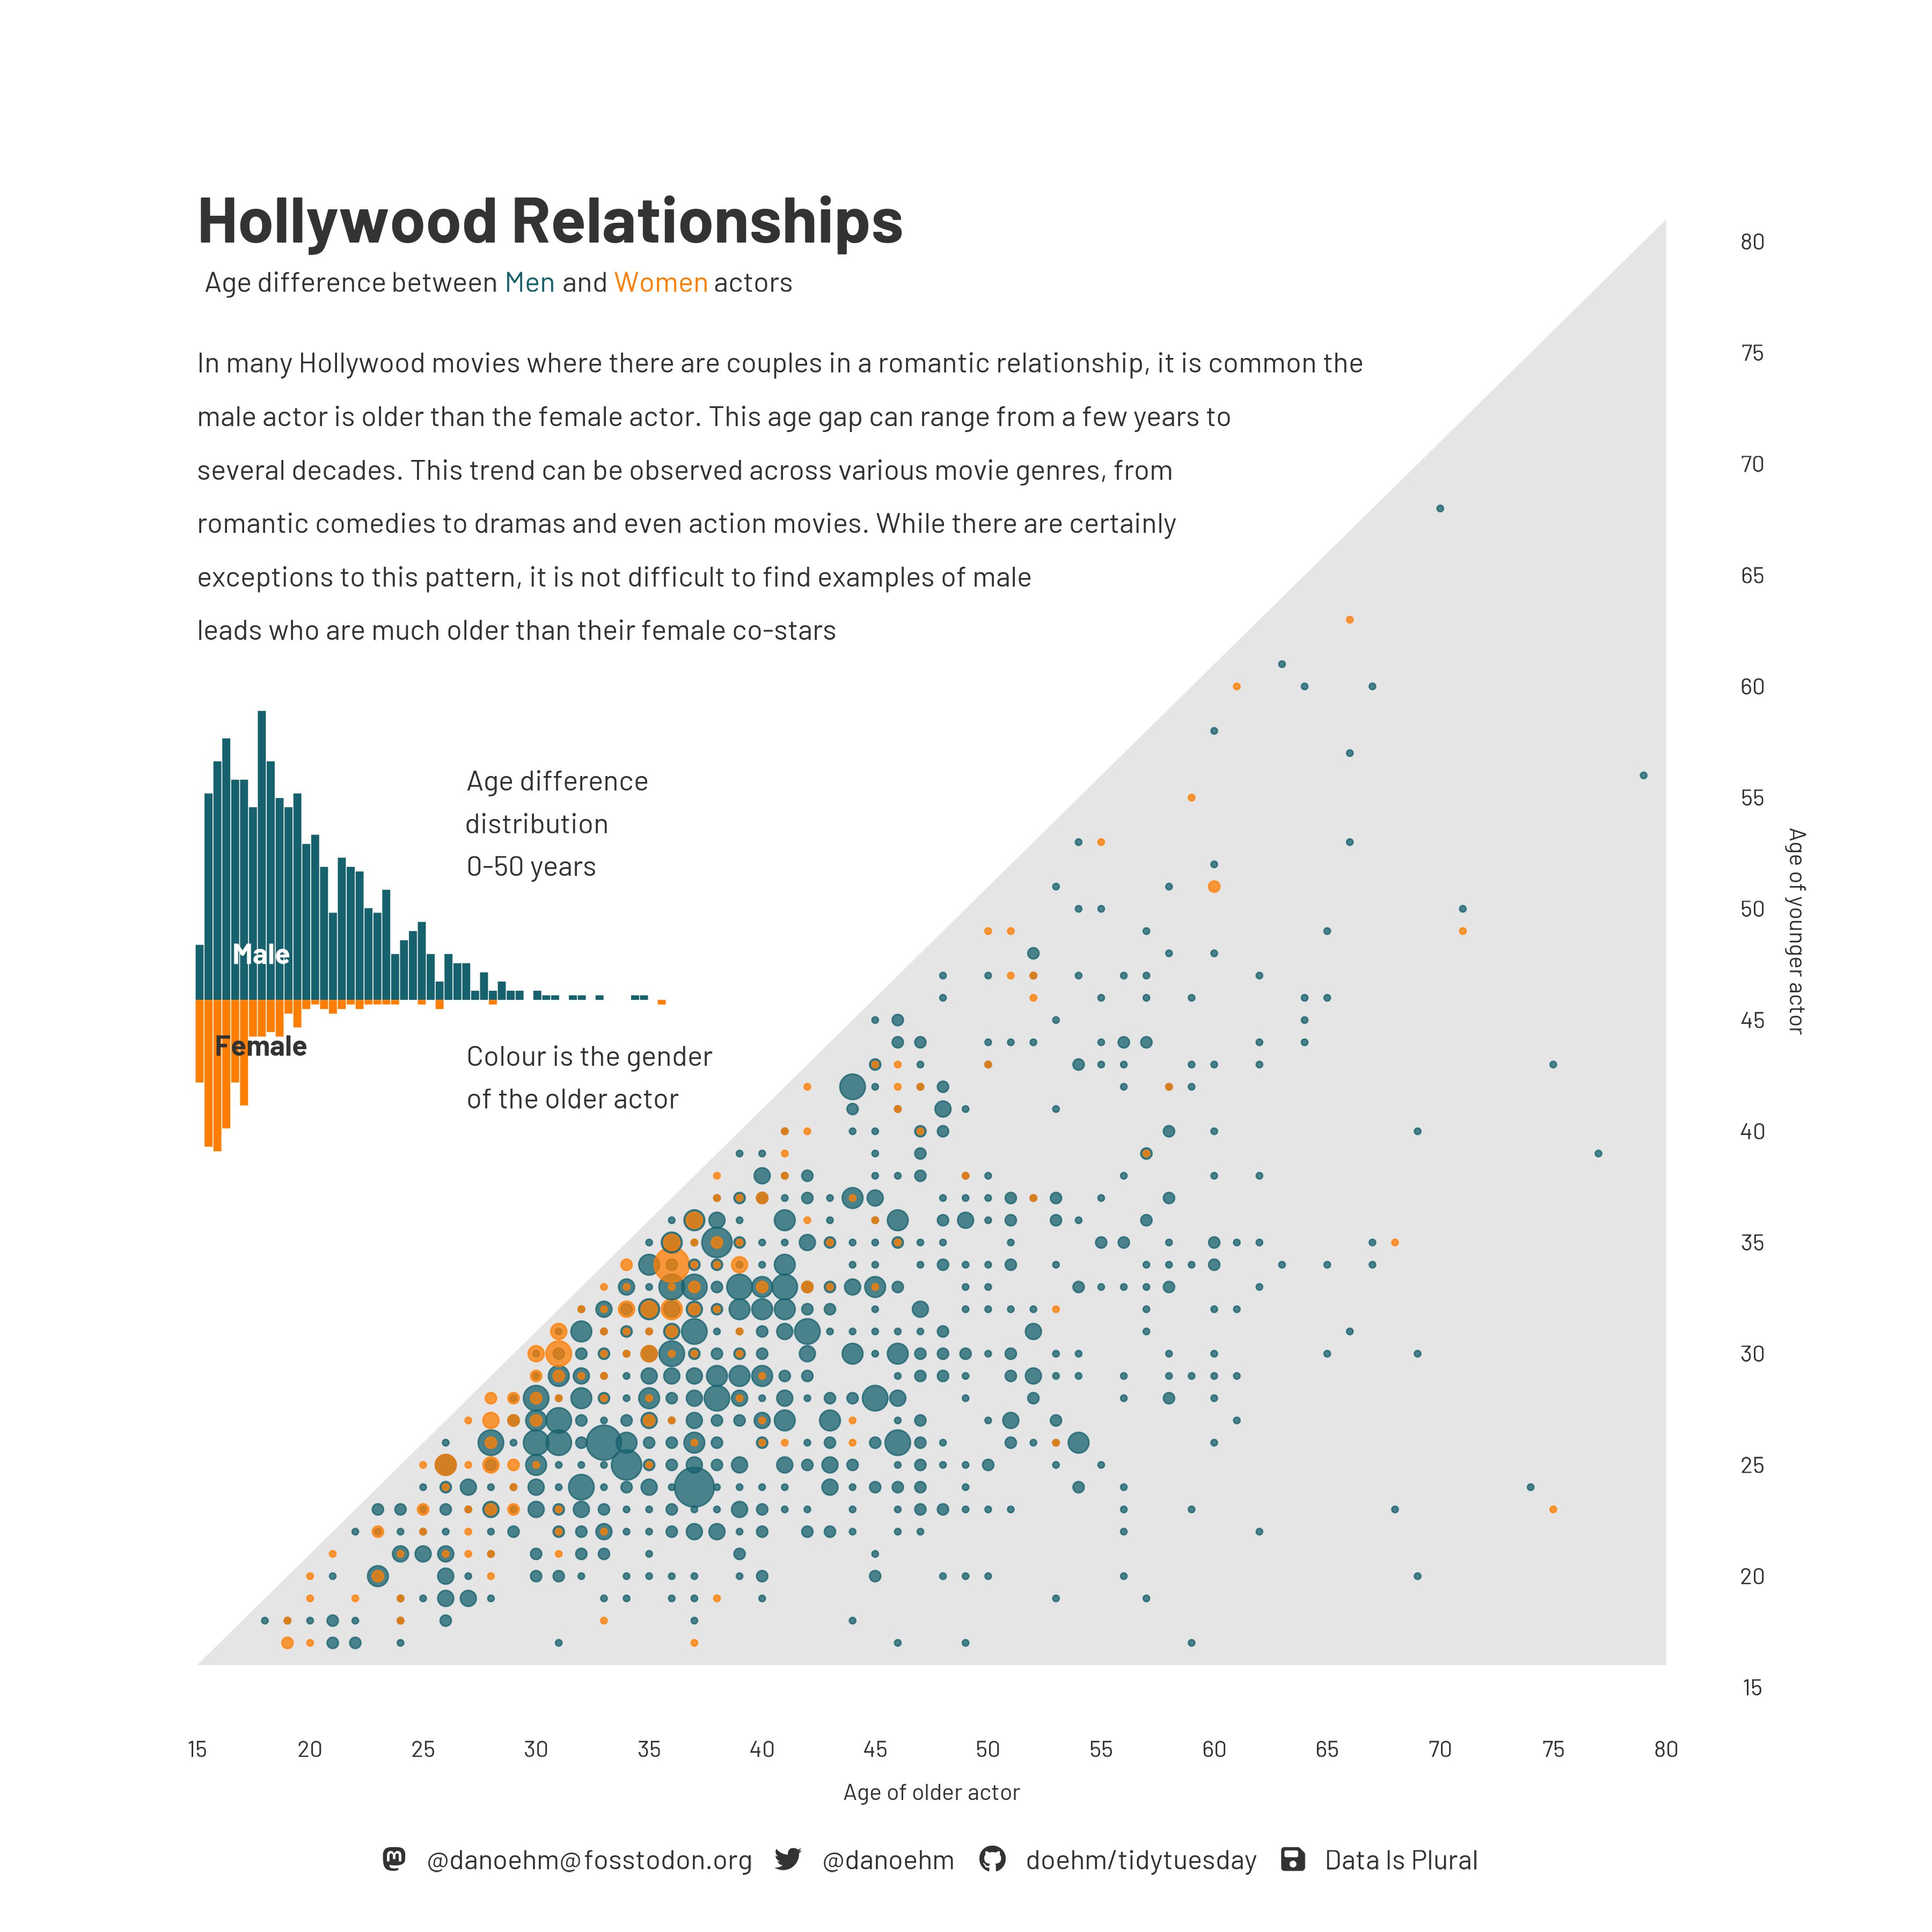
Age gap in Hollywood relationships

Identify and articulate one feature of the data based on this visualization.

ae-08-age-gaps-import

  • Go to your ae project in RStudio.

  • If you haven’t yet done so, make sure all of your changes up to this point are committed and pushed, i.e., there’s nothing left in your Git pane.

  • If you haven’t yet done so, click Pull to get today’s application exercise file: ae-08-age-gaps-import.qmd.

  • Work through the application exercise in class, and render, commit, and push your edits.