Language of models
Lecture 15
October 21, 2025
While you wait: Participate 📱💻
What might have been the reason for Google’s gendered translation? How do ethics play into this situation?
![]()

Scan the QR code or go to app.wooclap.com/sta199. Log in with your Duke NetID.
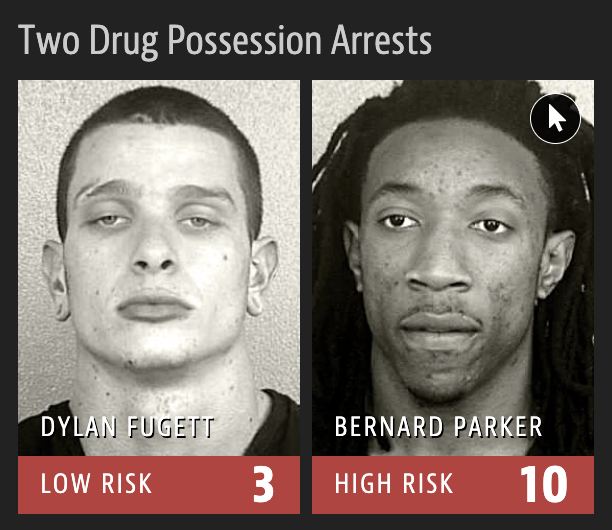
Criminal sentencing
2016 ProPublica article on algorithm used for rating a defendant’s risk of future crime:

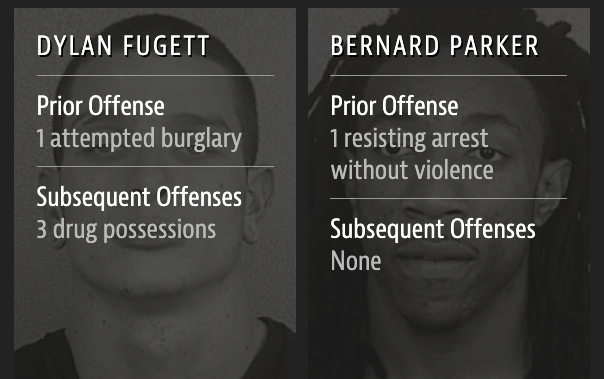
Risk score errors
What is common among the defendants who were assigned a high/low risk score for reoffending?


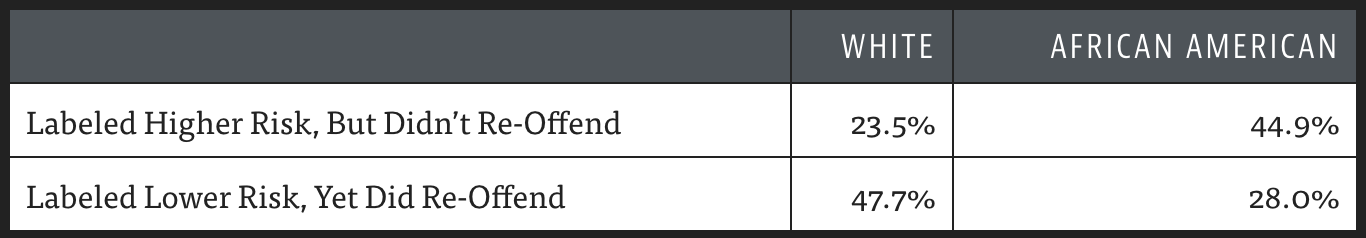
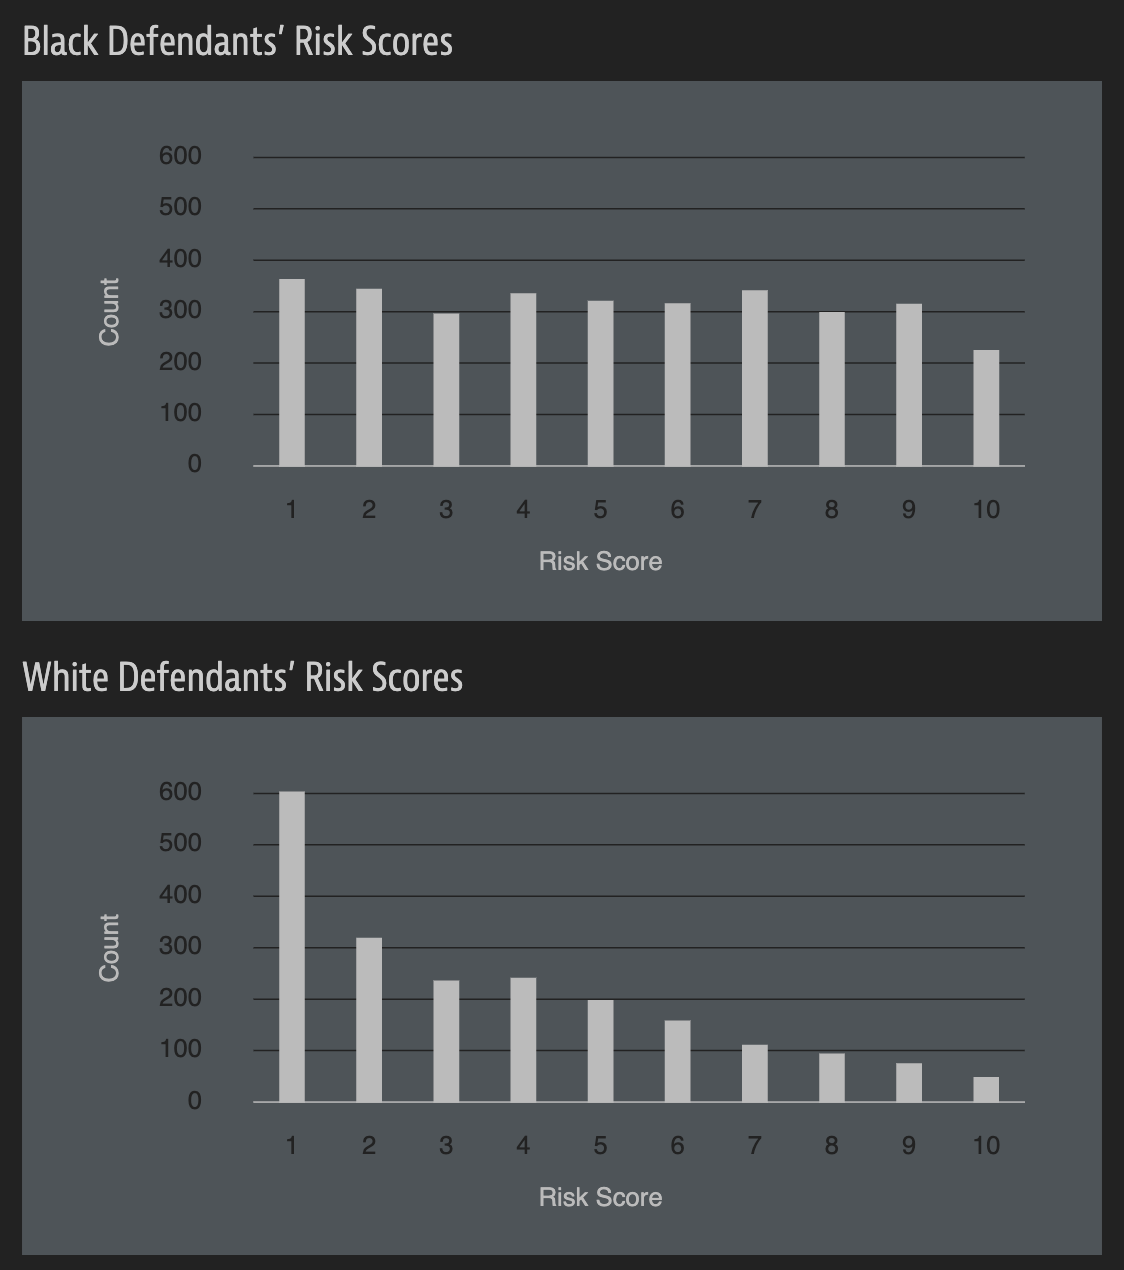
ProPublica analysis
Data: Risk scores assigned to >7,000 people arrested in Broward County, FL + whether they were charged with new crimes over the following 2 years.
Results:
- 20% of those predicted to commit violent crimes actually did.
- Algorithm had higher accuracy (61%) when full range of crimes taken into account (e.g. misdemeanors).
![]()
- Algorithm was more likely to falsely flag black defendants as future criminals, at almost twice the rate as white defendants.
- White defendants were mislabeled as low risk more often than black defendants.
Risk scores
How can an algorithm that doesn’t use race as input data be racist?
Prediction gone wrong…
Tesla thinks my garage is a semi…

Modeling cars
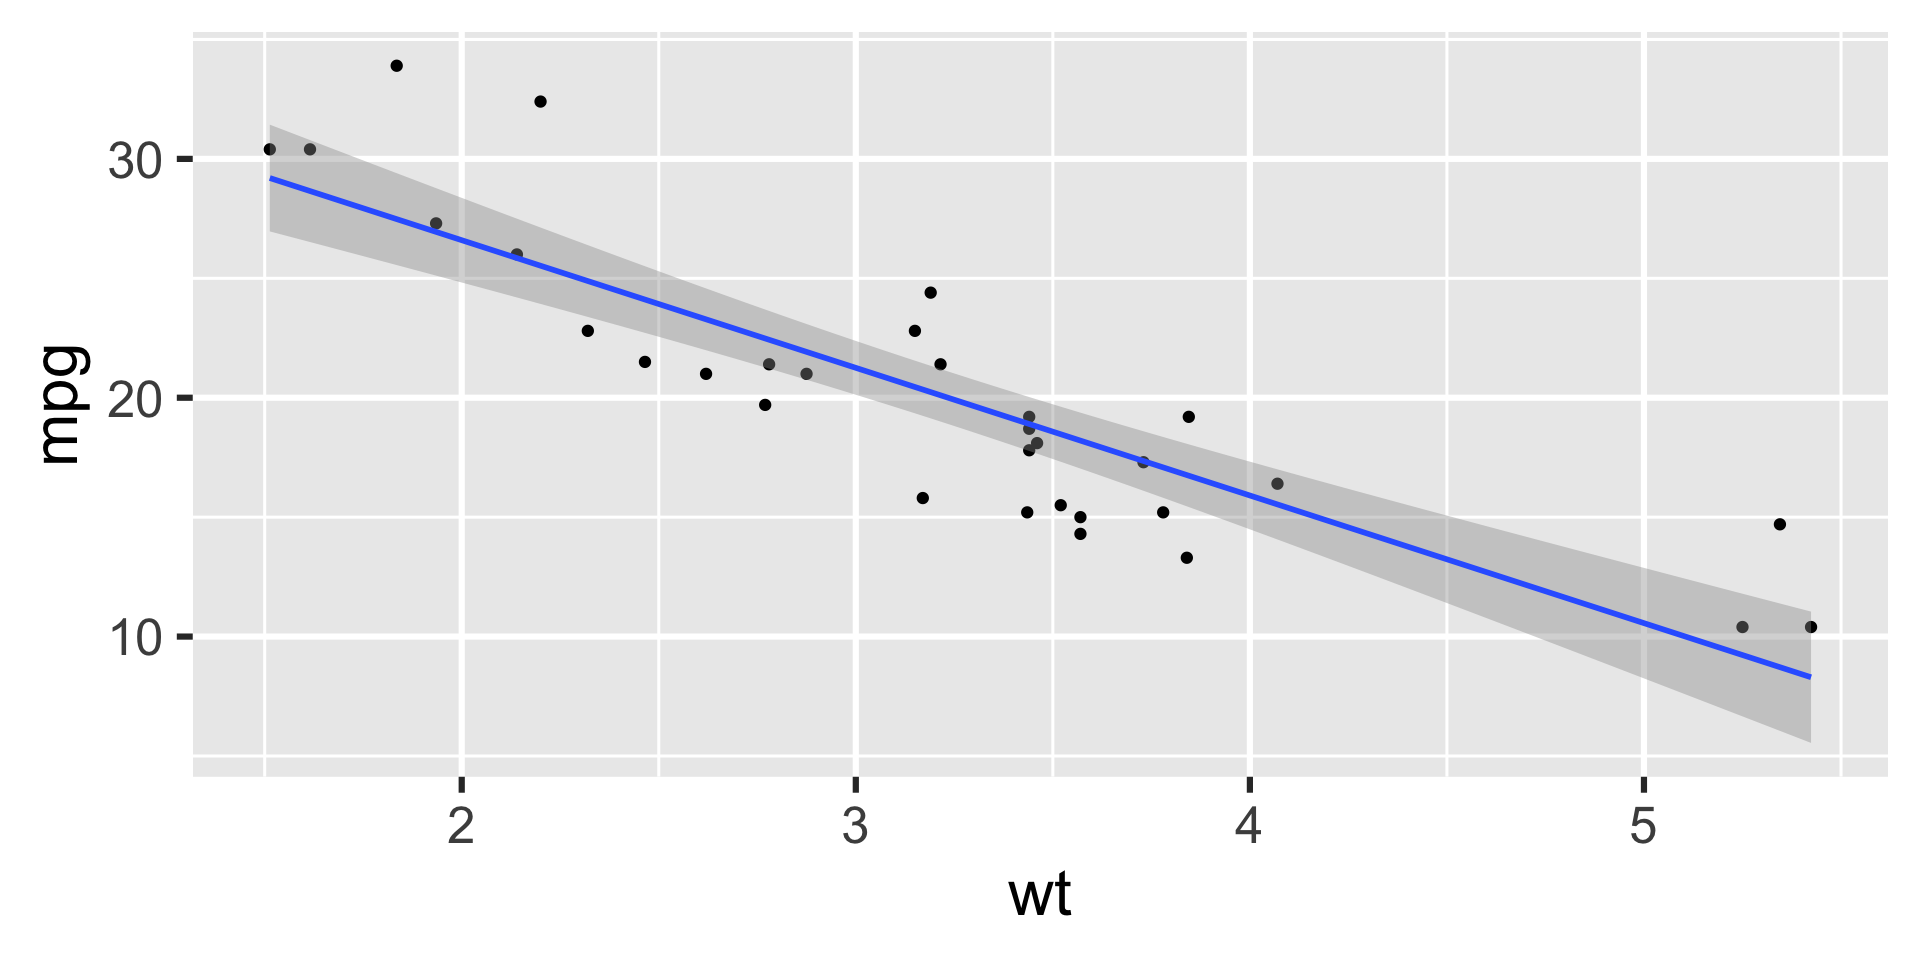
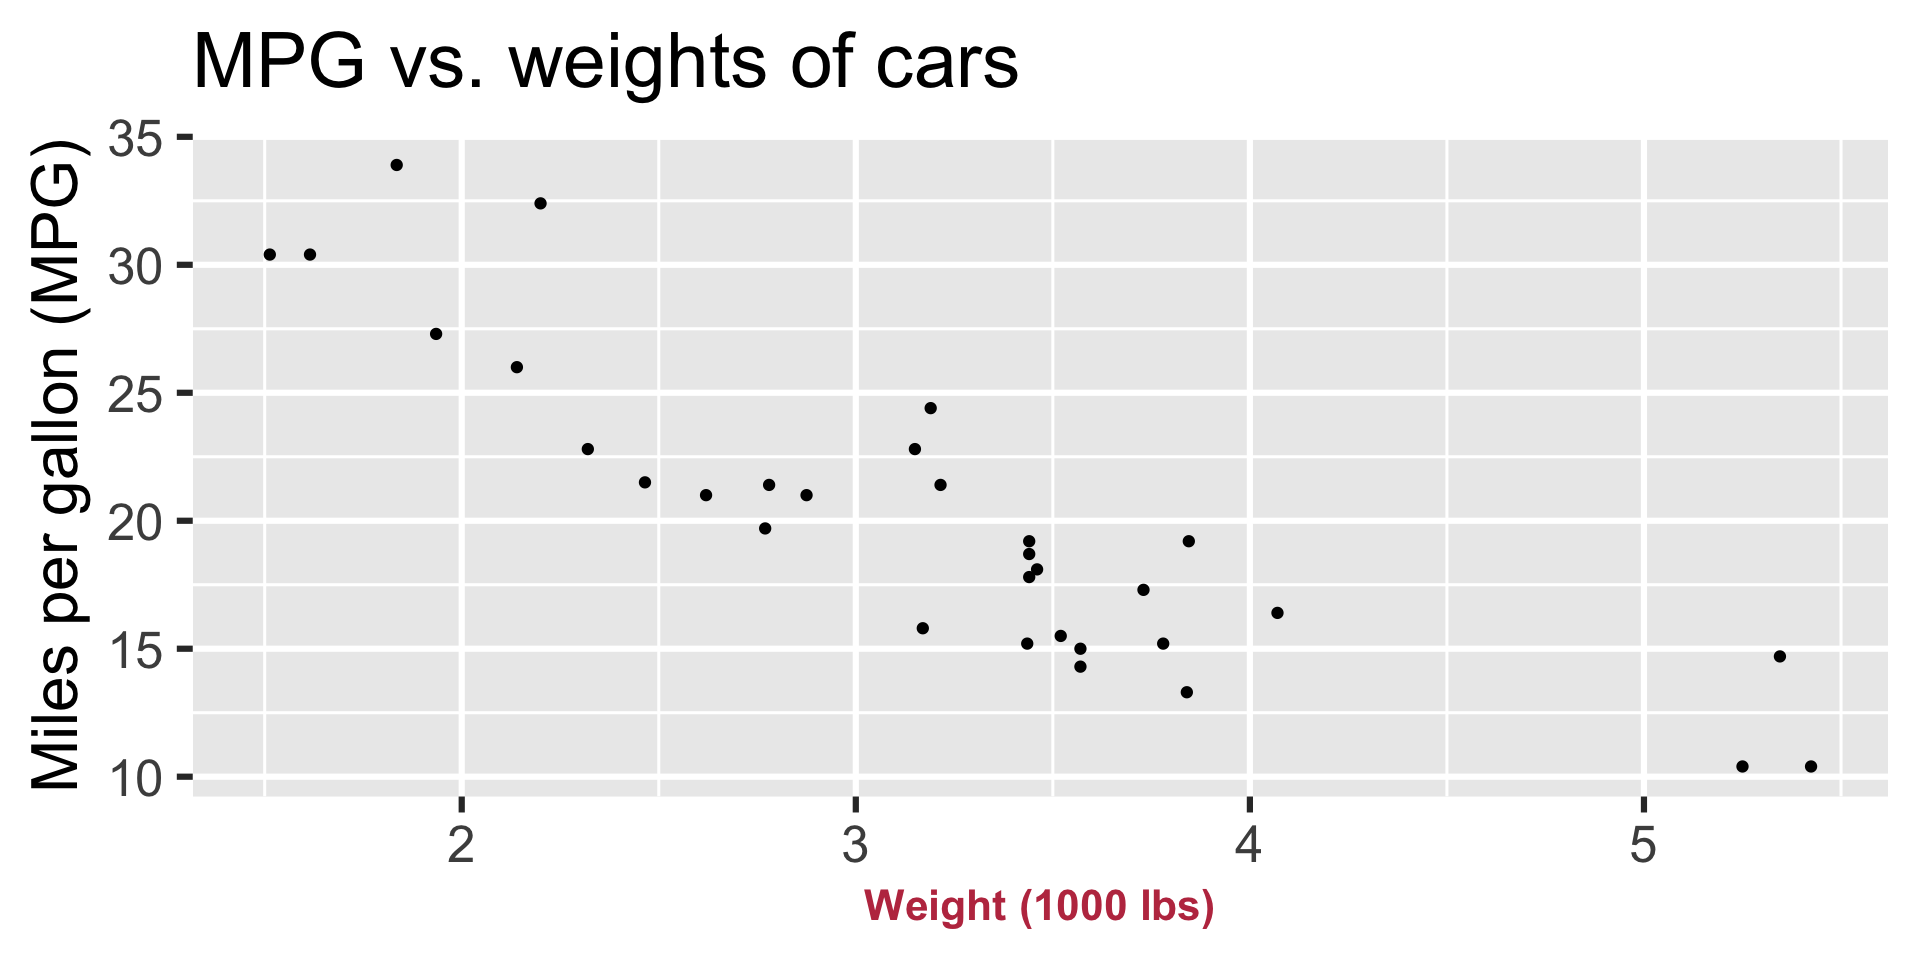
- What is the relationship between cars’ weights and their mileage?
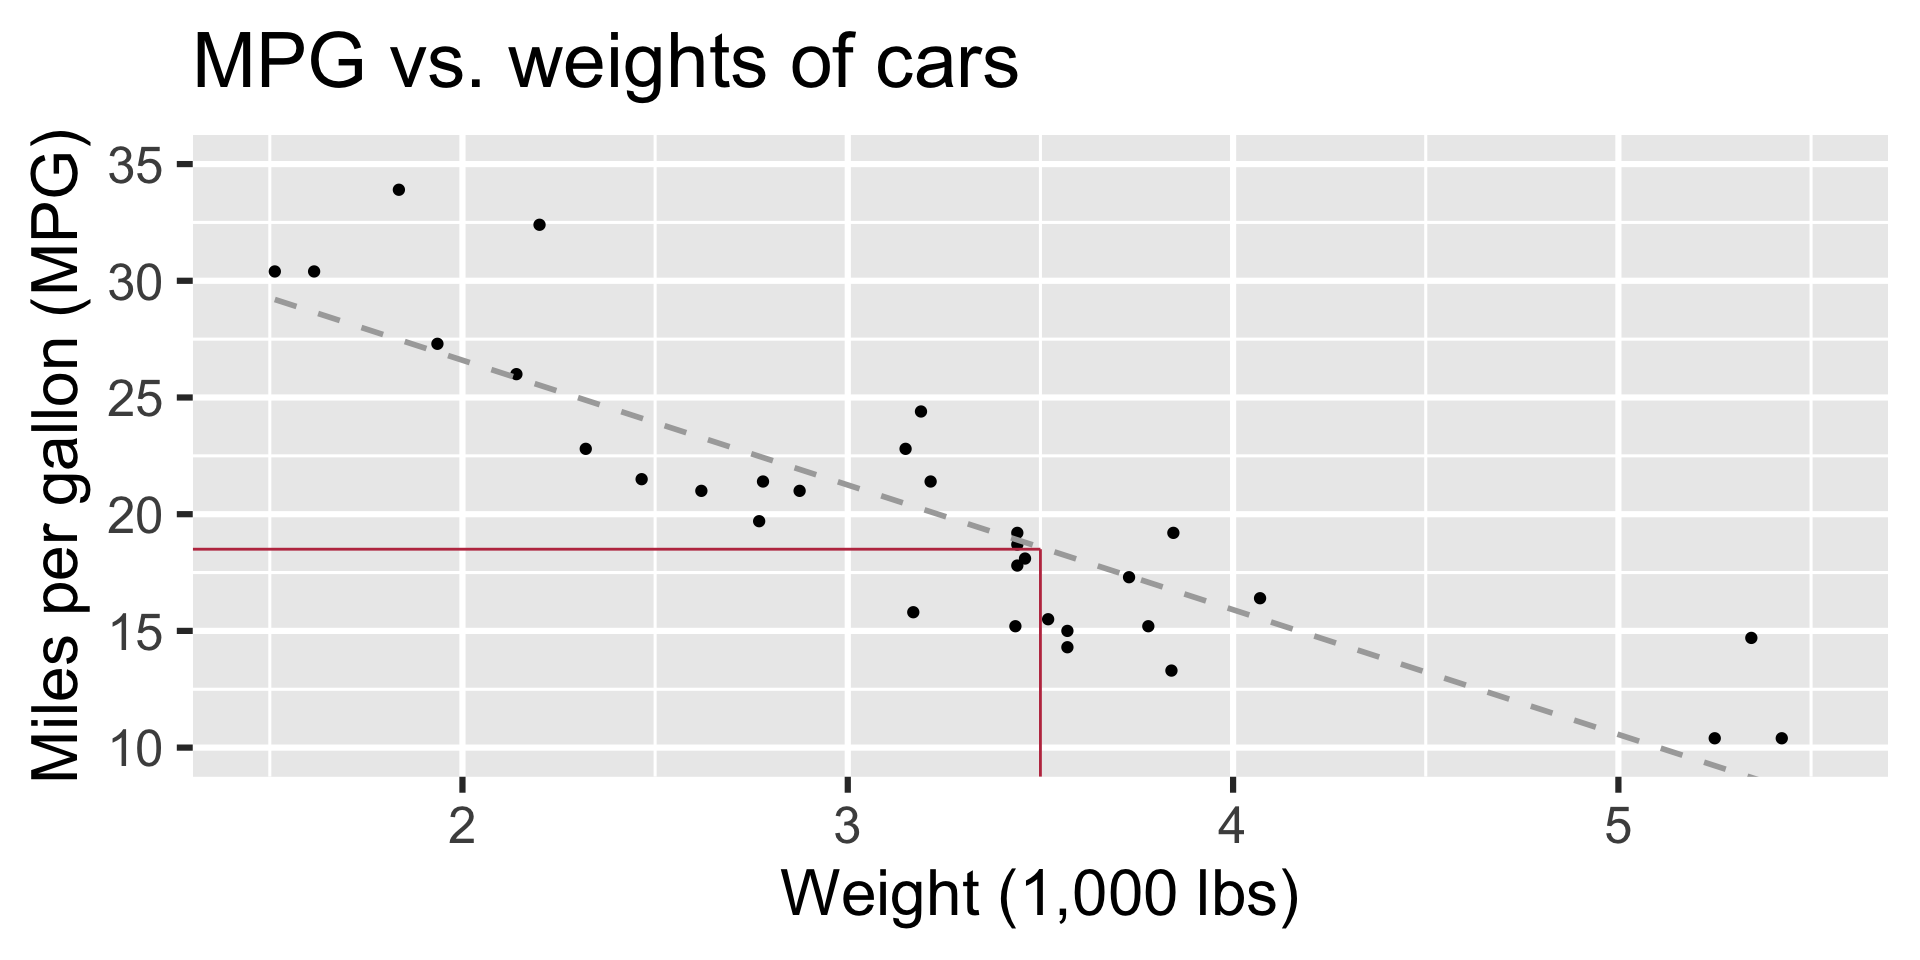
- What is your best guess for a car’s MPG that weighs 3,500 pounds?
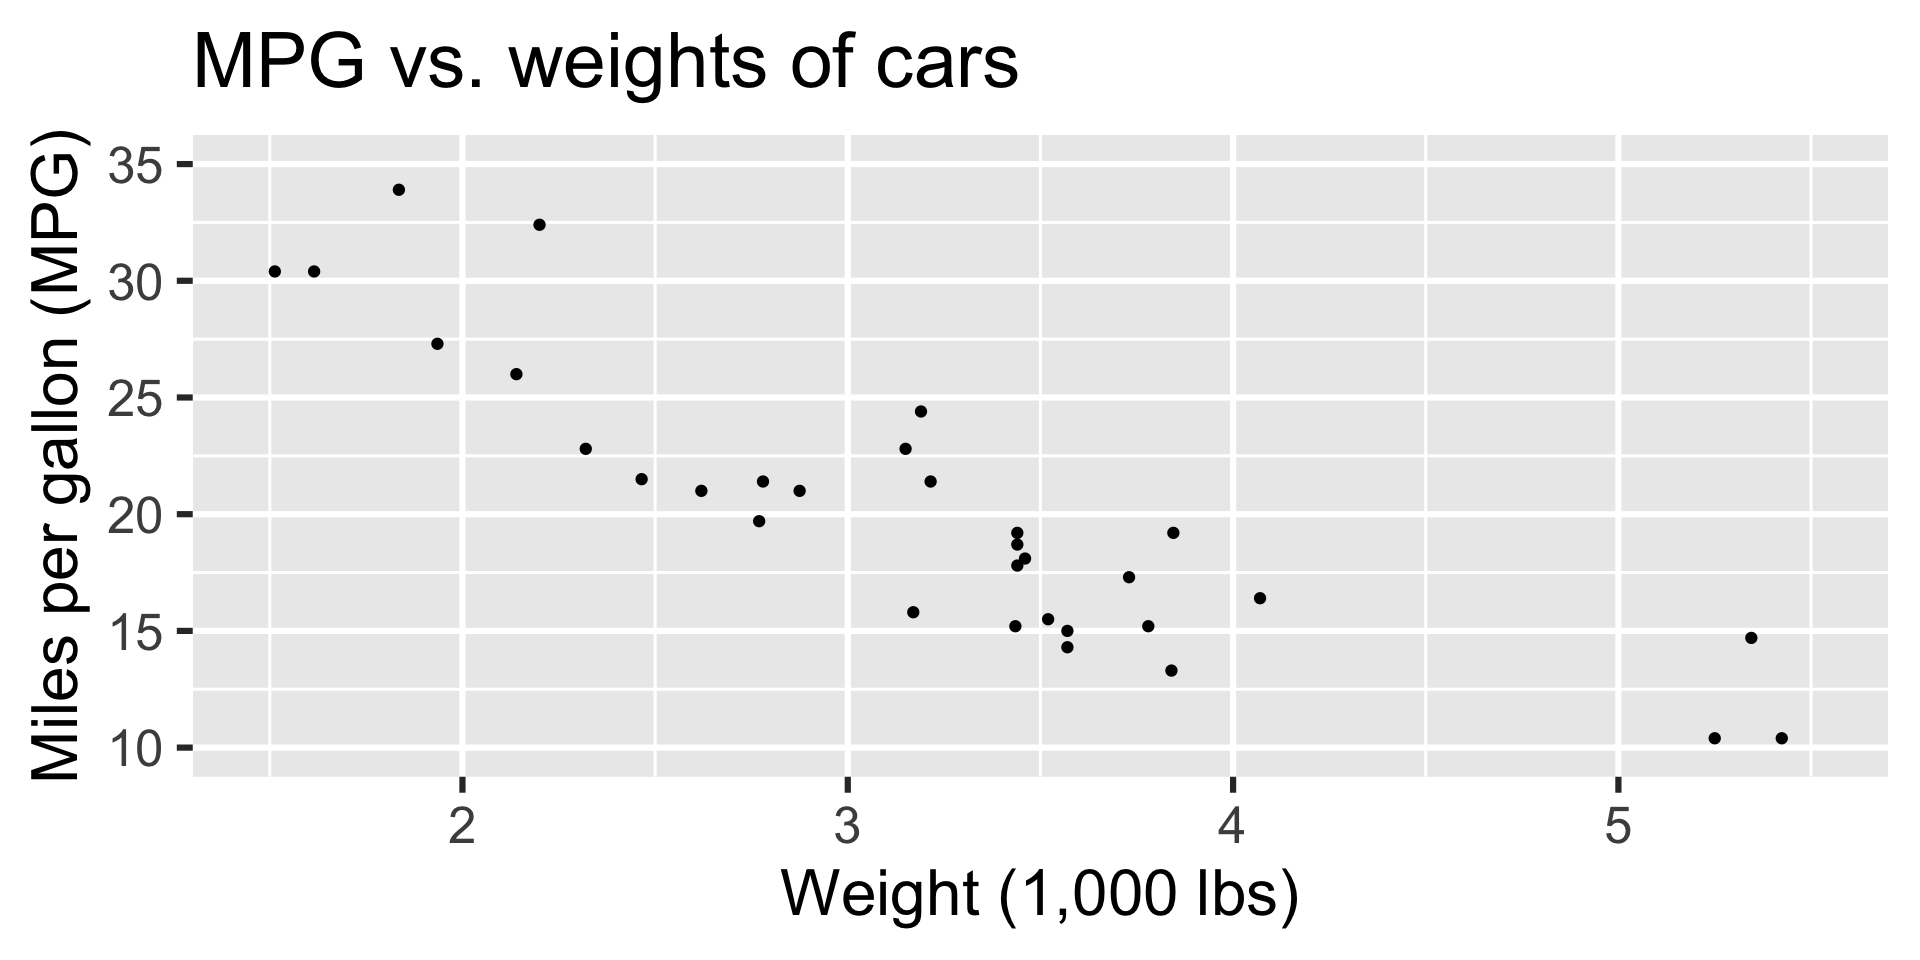
Modelling cars
Describe: What is the relationship between cars’ weights and their mileage?
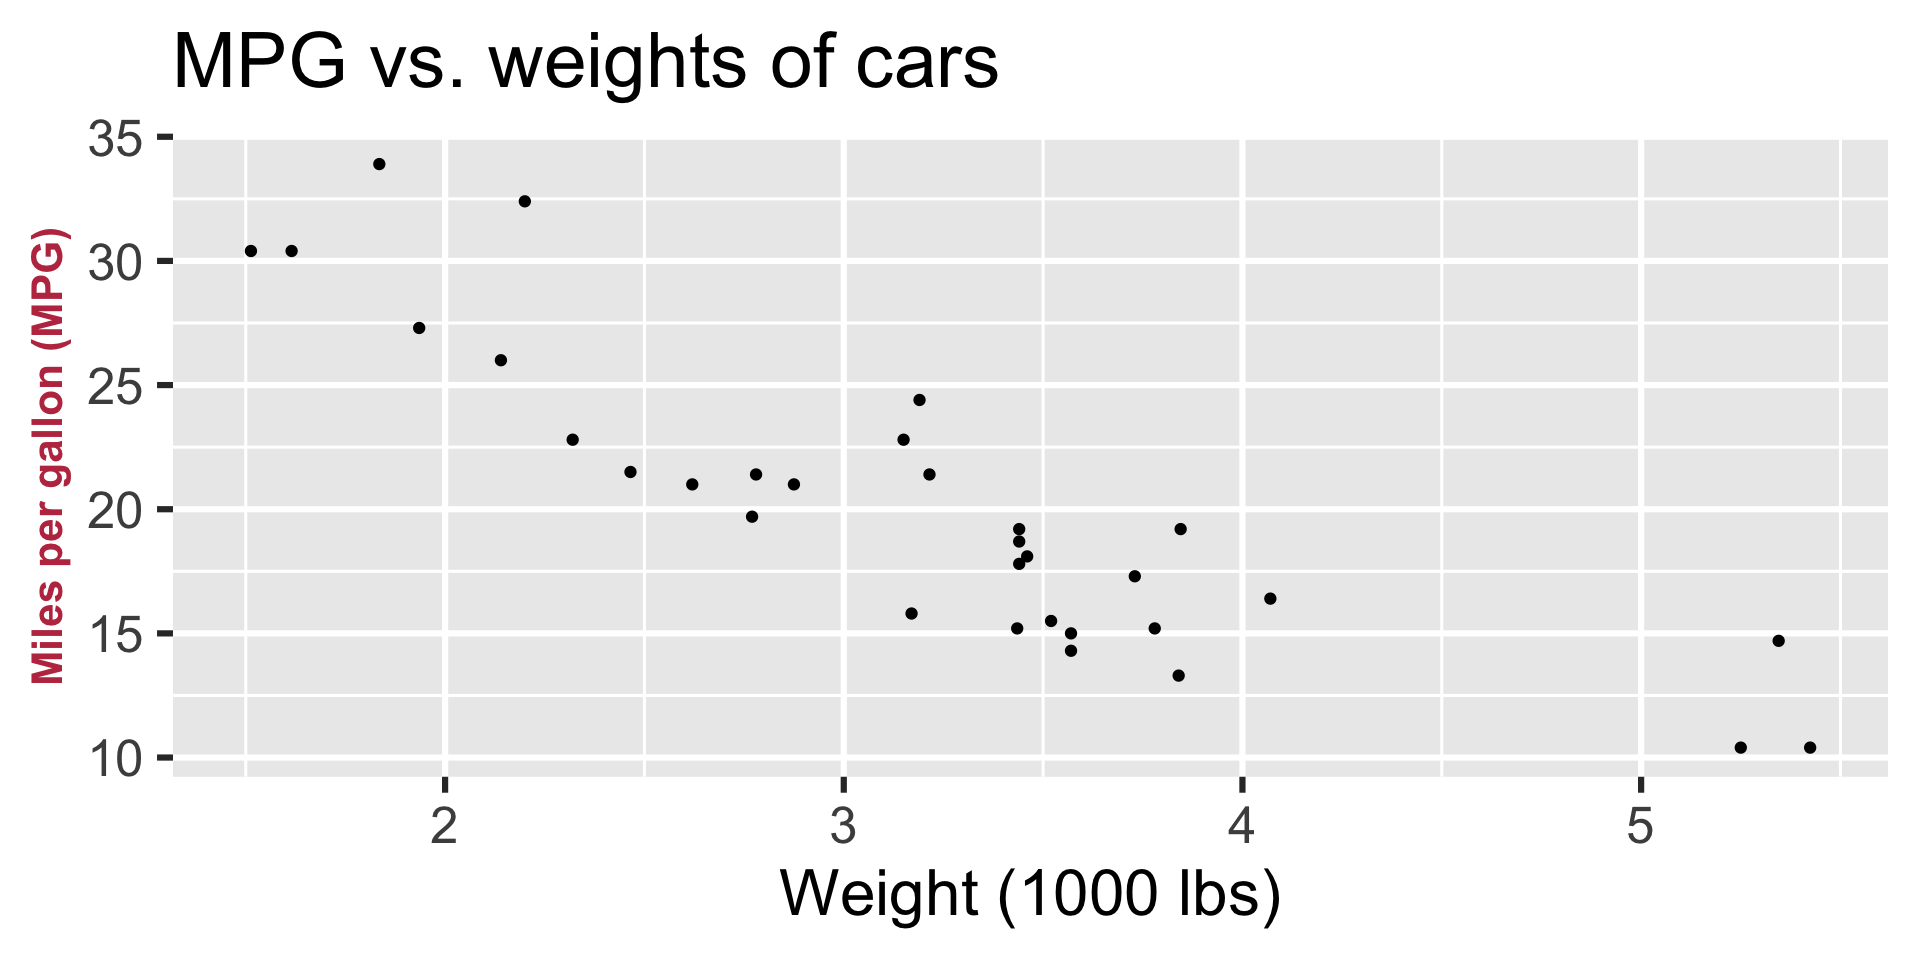
Modelling cars
Predict: What is your best guess for a car’s MPG that weighs 3,500 pounds?
Predictor (explanatory variable)
| mpg | wt |
|---|---|
| 21 | 2.62 |
| 21 | 2.875 |
| 22.8 | 2.32 |
| 21.4 | 3.215 |
| 18.7 | 3.44 |
| 18.1 | 3.46 |
| ... | ... |
Outcome (response variable)
| mpg | wt |
|---|---|
| 21 | 2.62 |
| 21 | 2.875 |
| 22.8 | 2.32 |
| 21.4 | 3.215 |
| 18.7 | 3.44 |
| 18.1 | 3.46 |
| ... | ... |
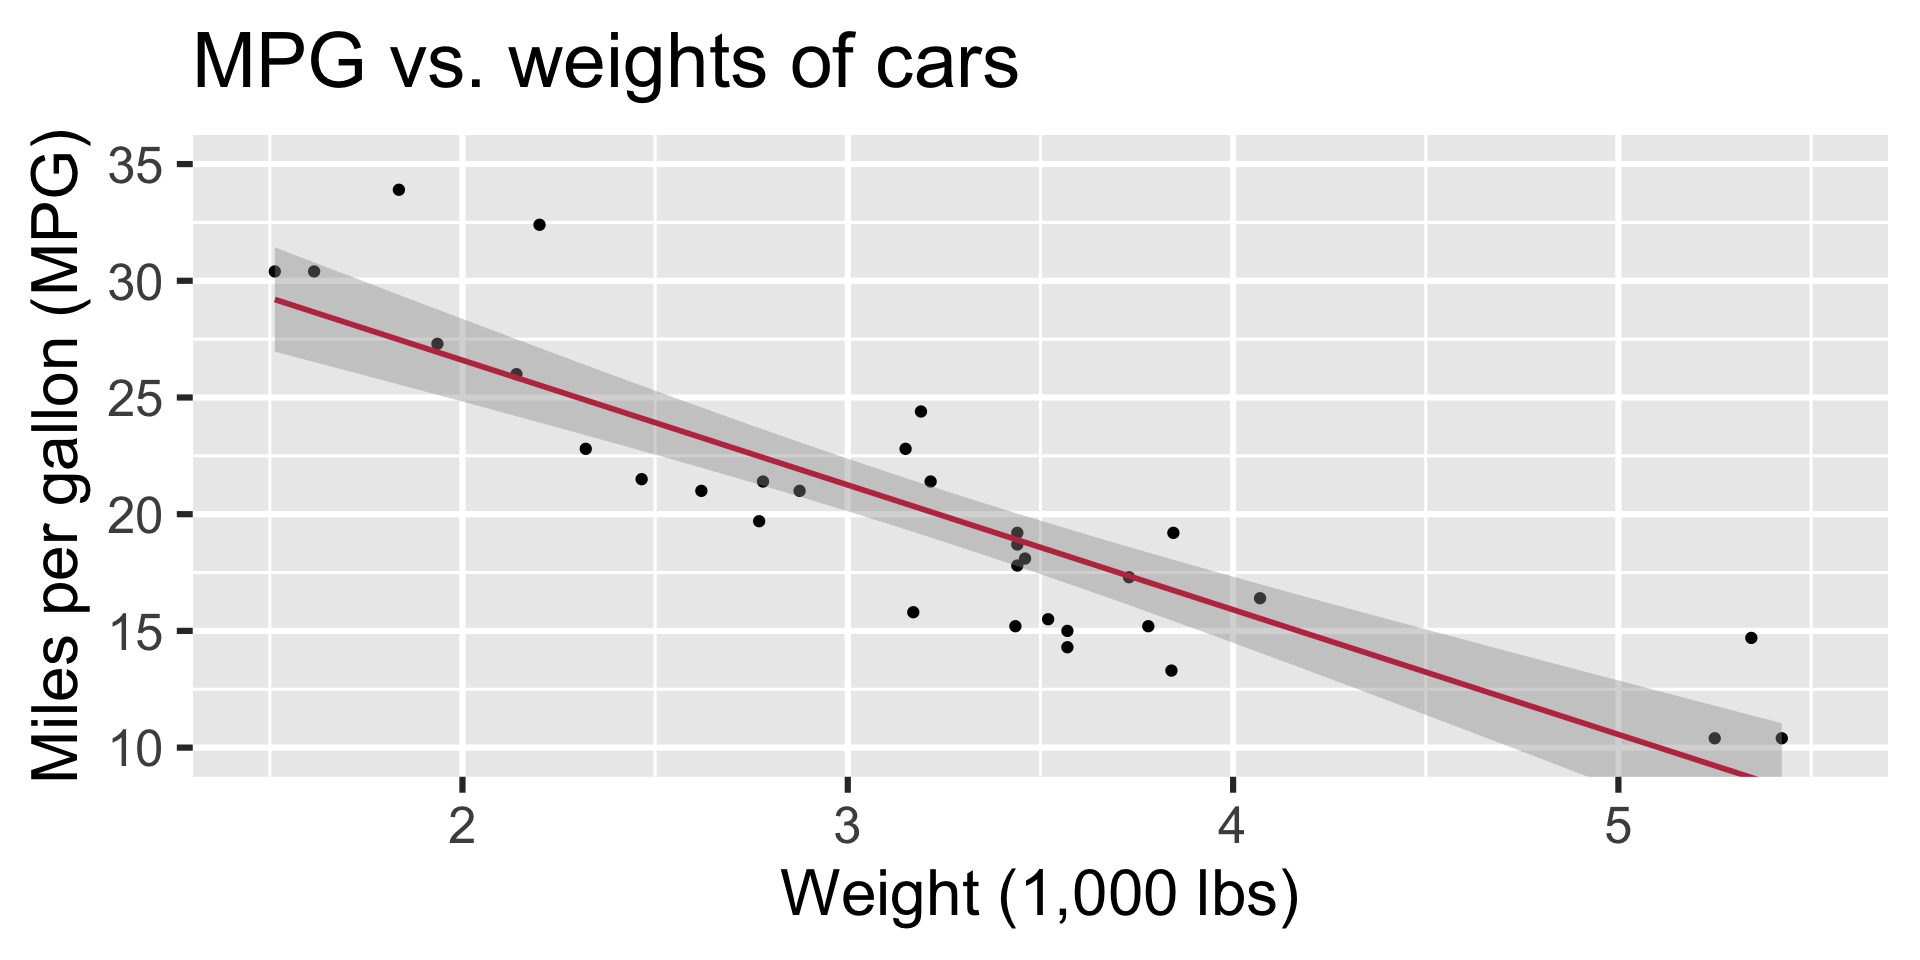
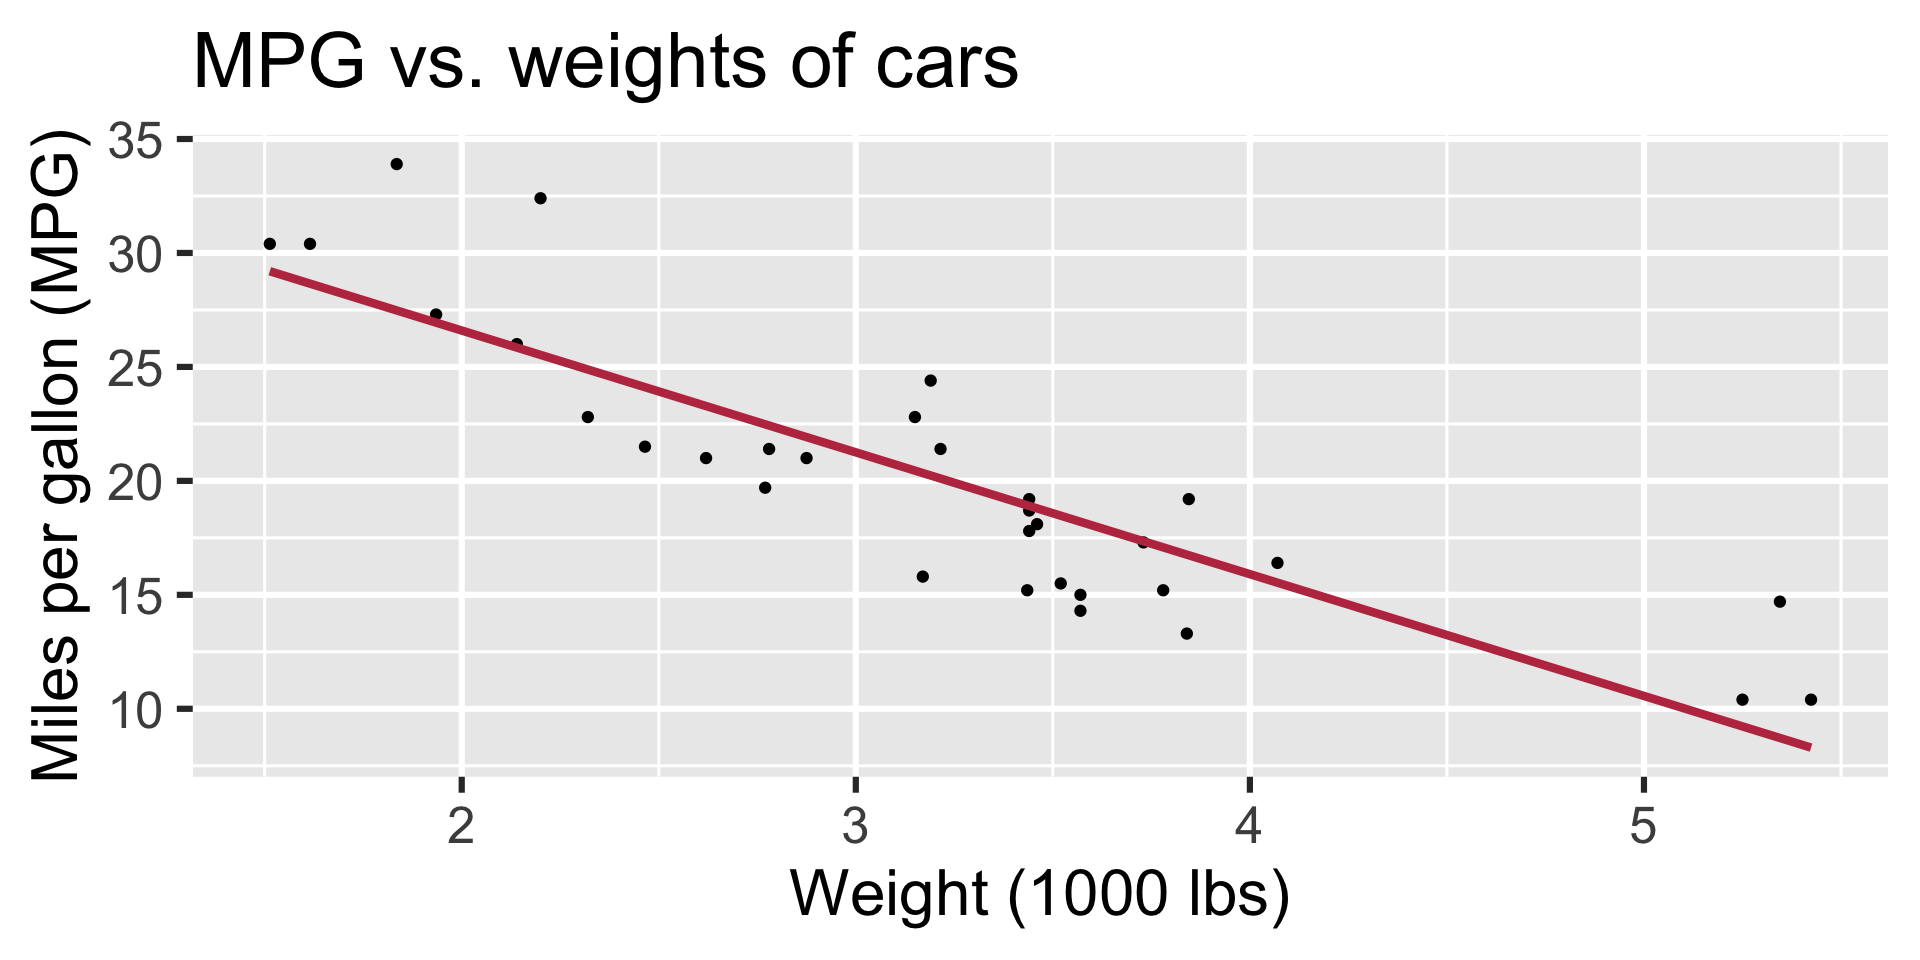
Regression line
Regression line: slope
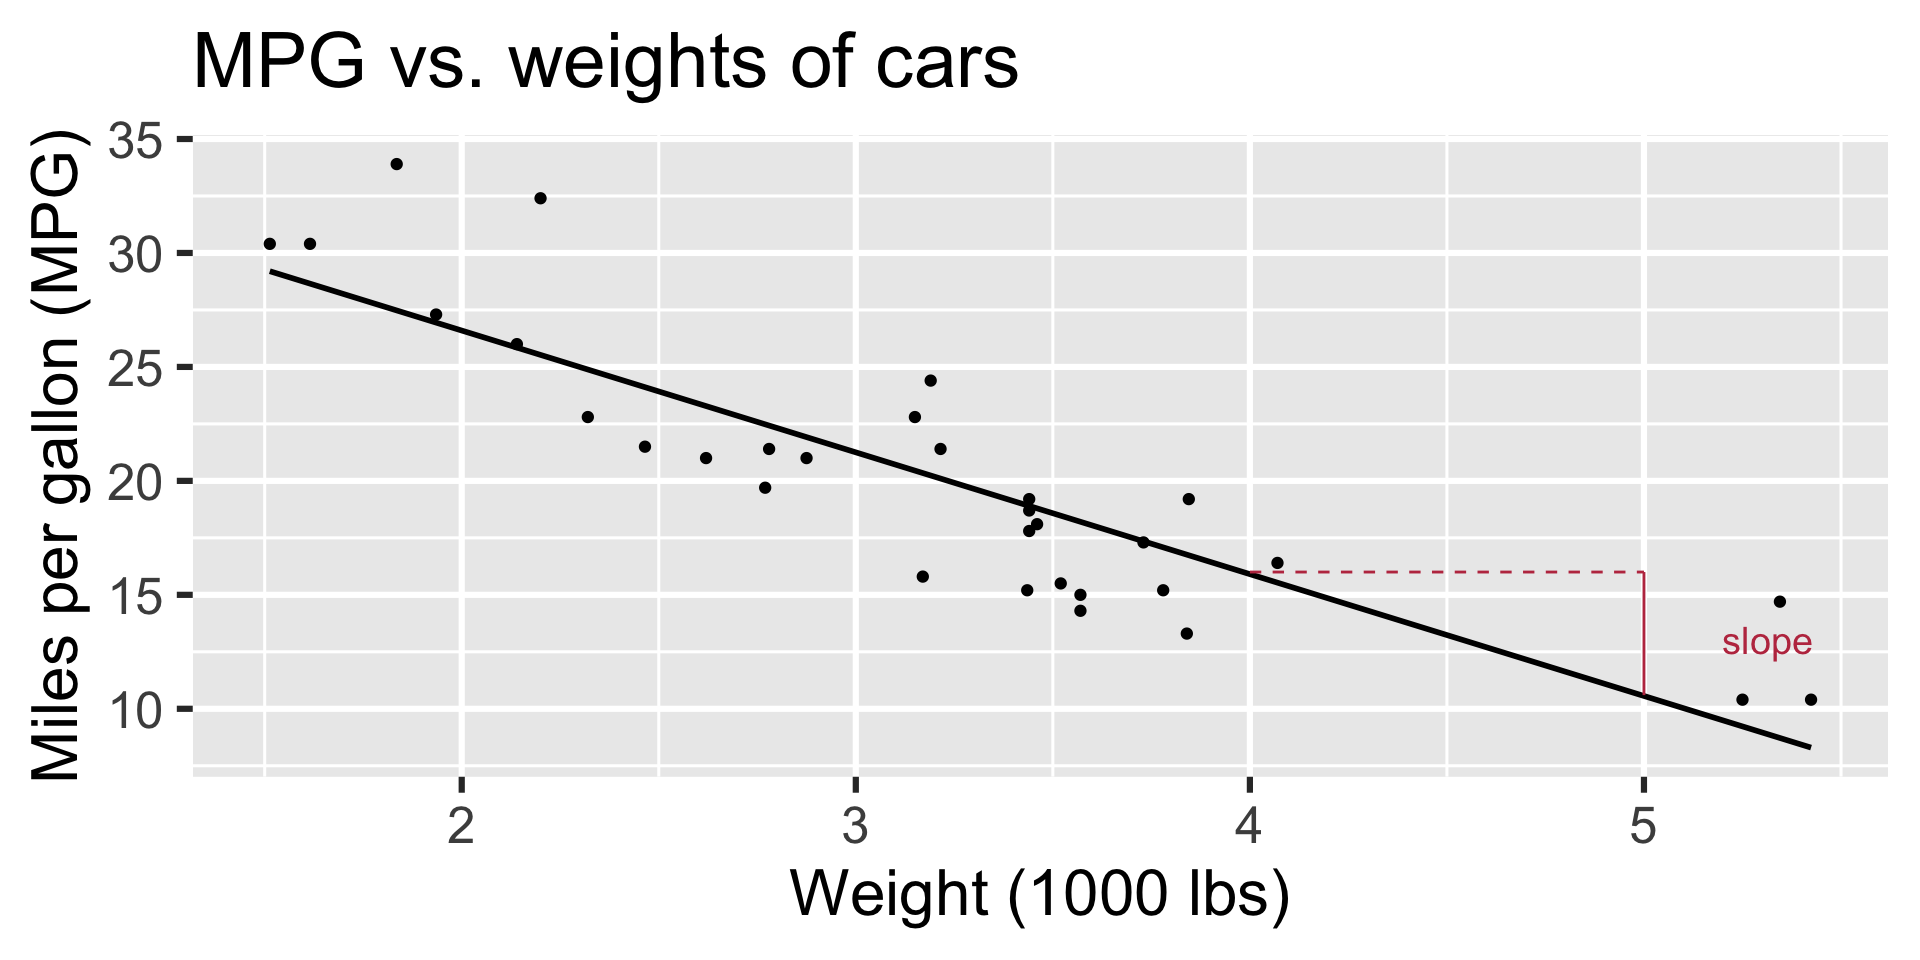
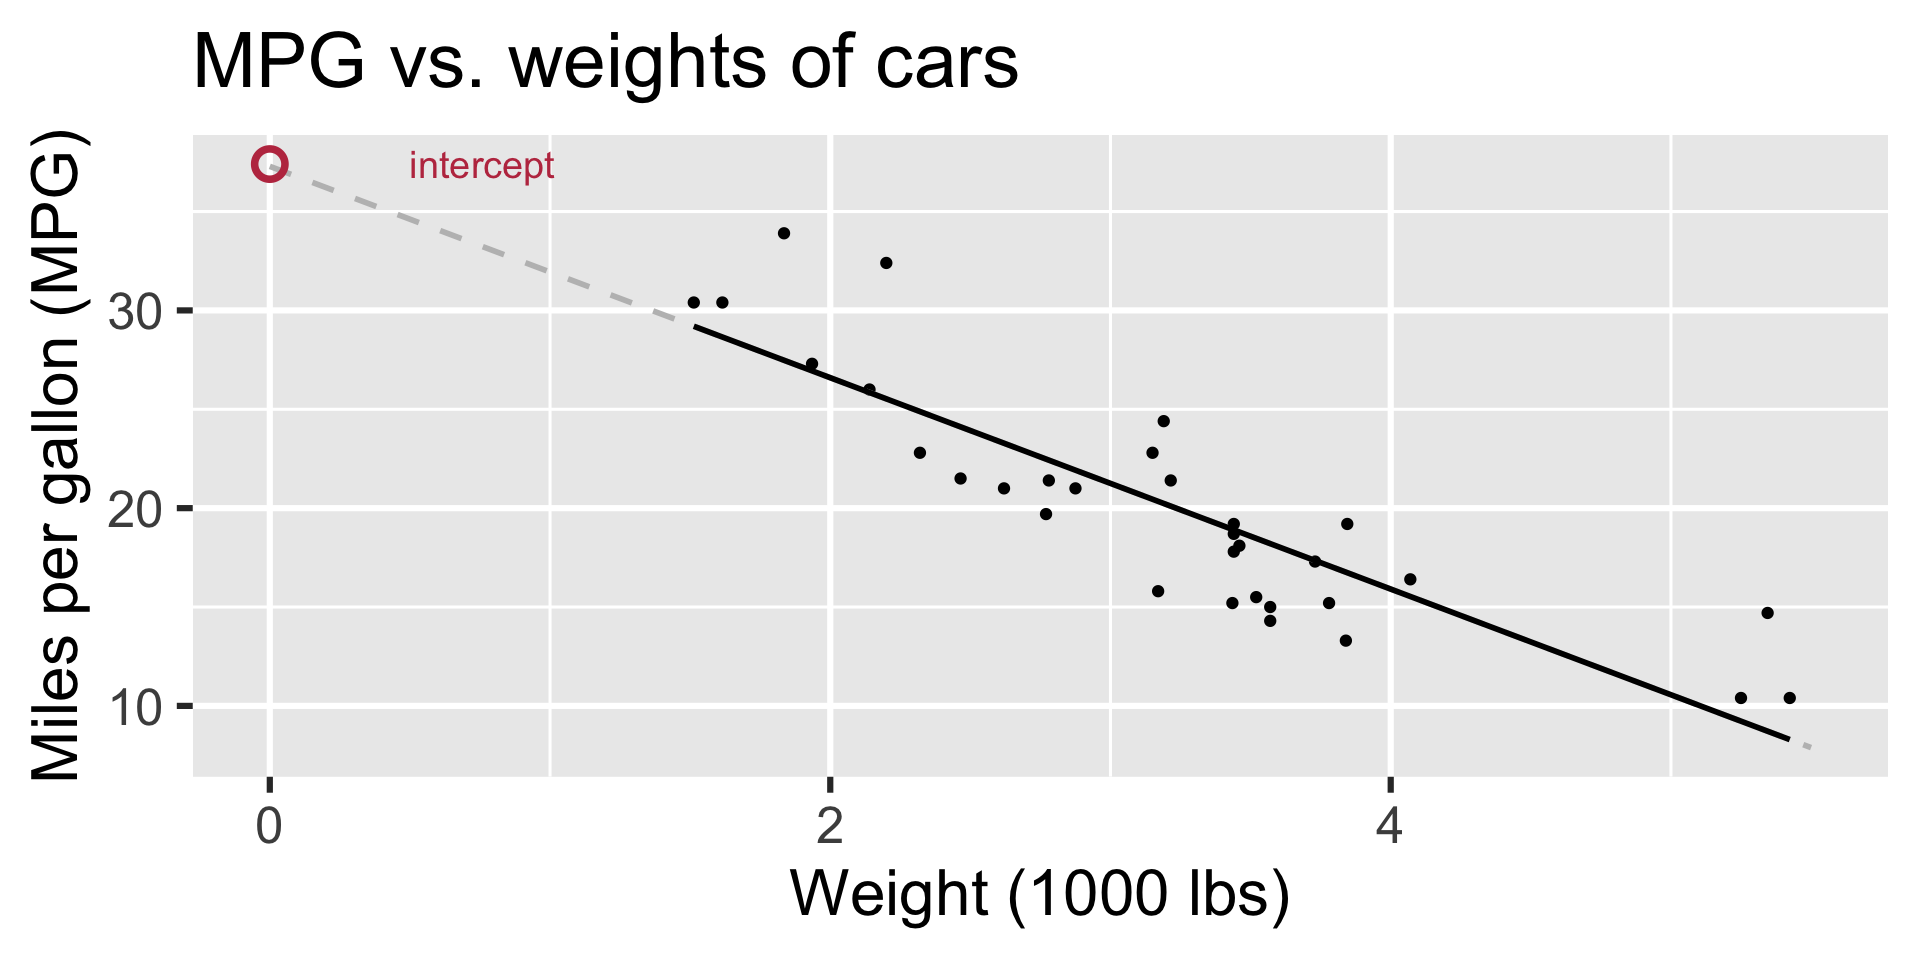
Regression line: intercept
Correlation
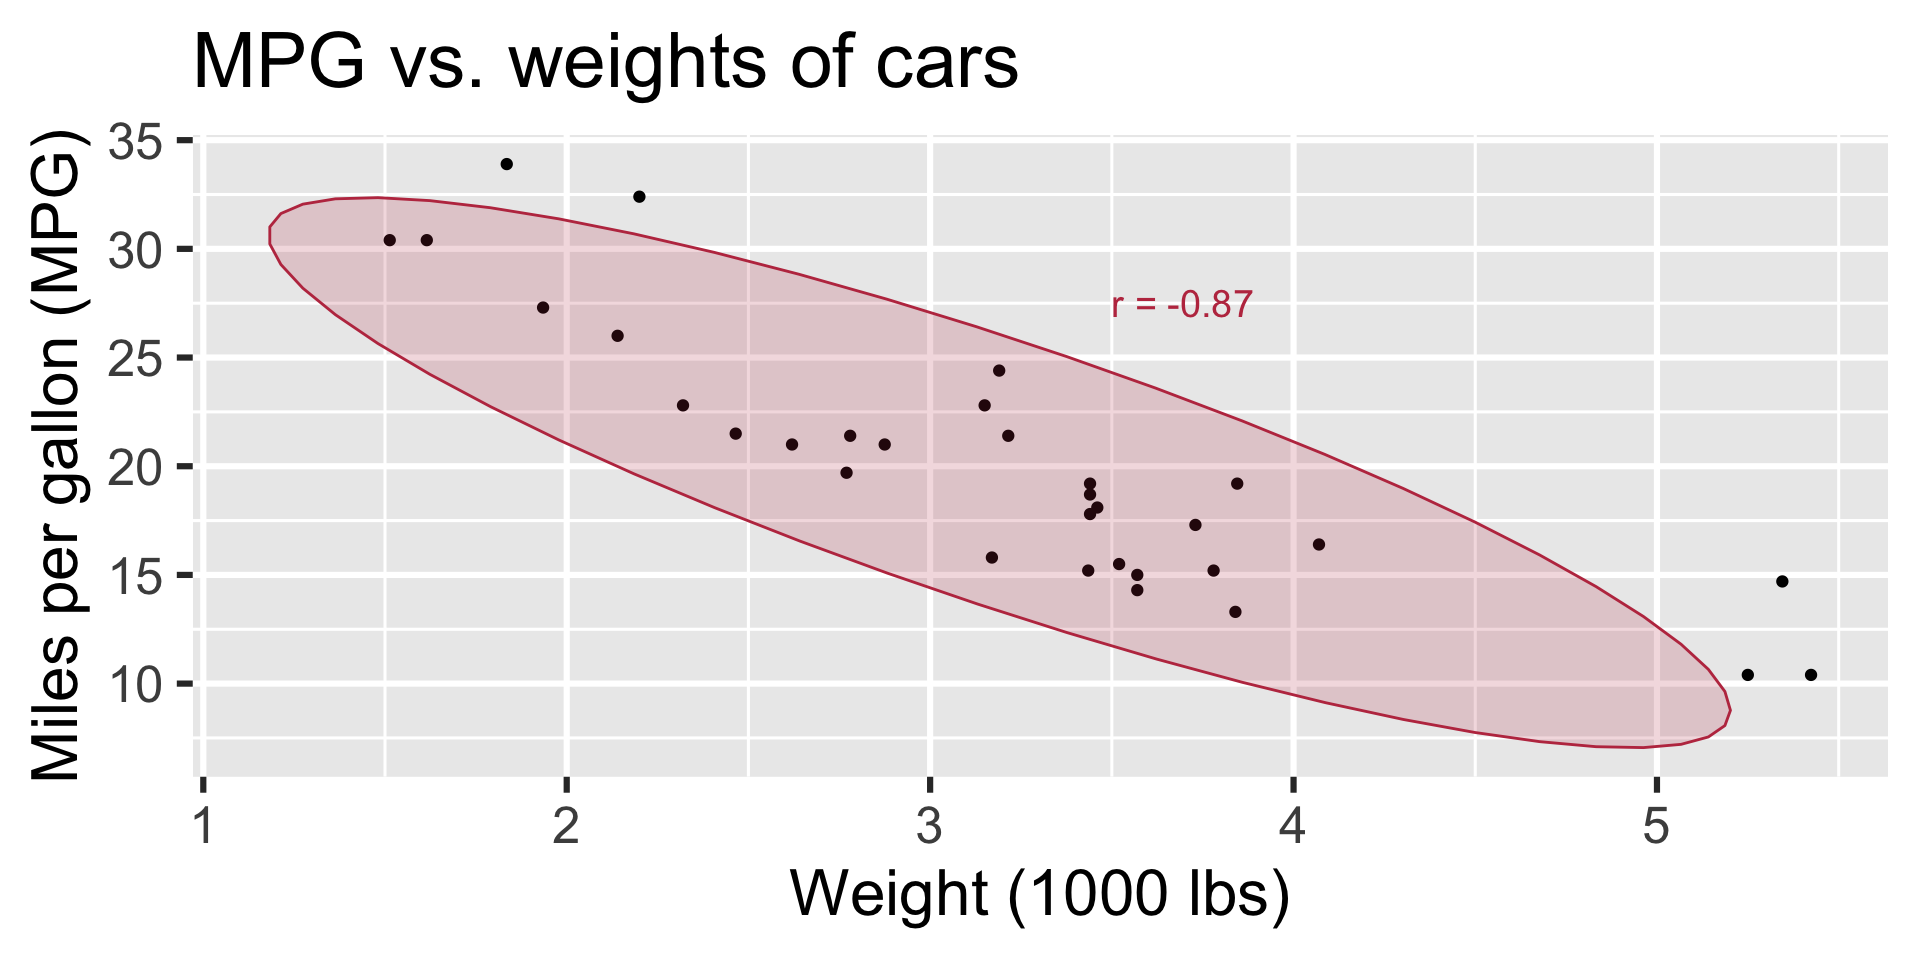
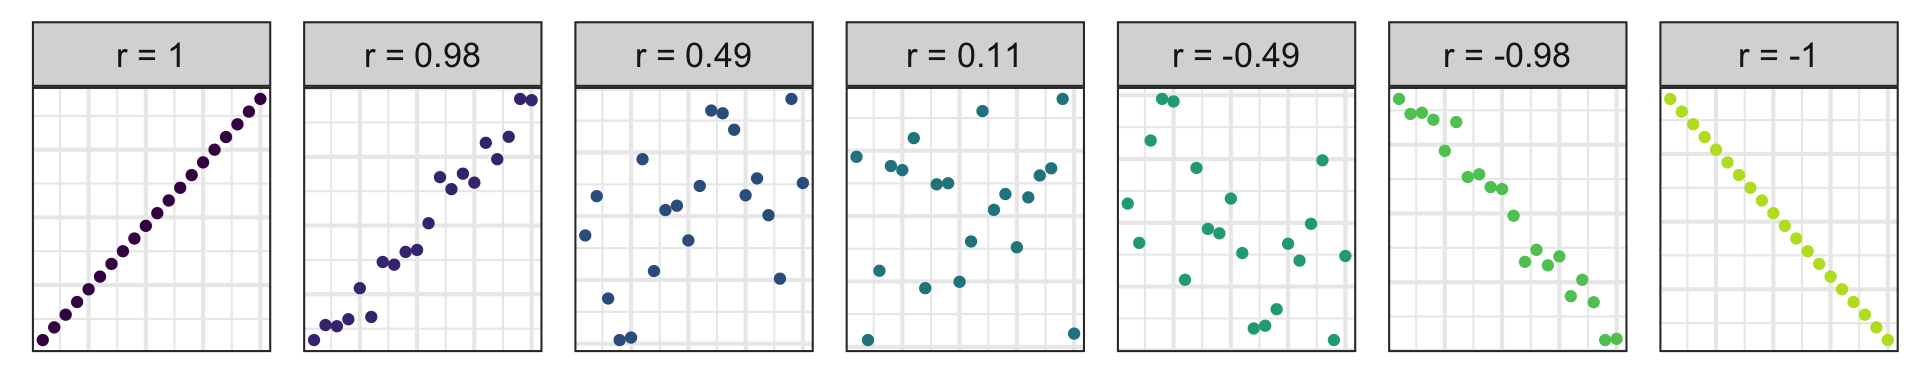
Correlation
- Ranges between -1 and 1.
- Same sign as the slope.
Participate 📱💻
Which of the following is the best guess for the correlation between the to variables on the plot below?
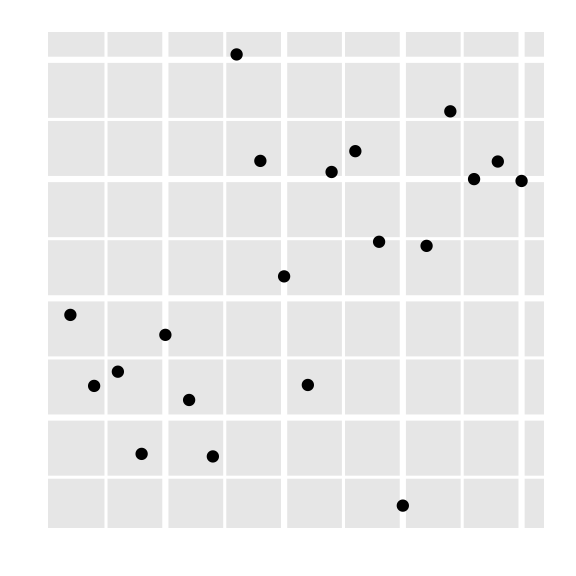
-0.95
-0.53
0.00
0.25
0.80
Scan the QR code or go to app.wooclap.com/sta199. Log in with your Duke NetID.
Visualizing the model
`geom_smooth()` using formula = 'y ~ x'