Exam 1 review
Lecture 11
September 30, 2025
While you wait: Participate 📱💻
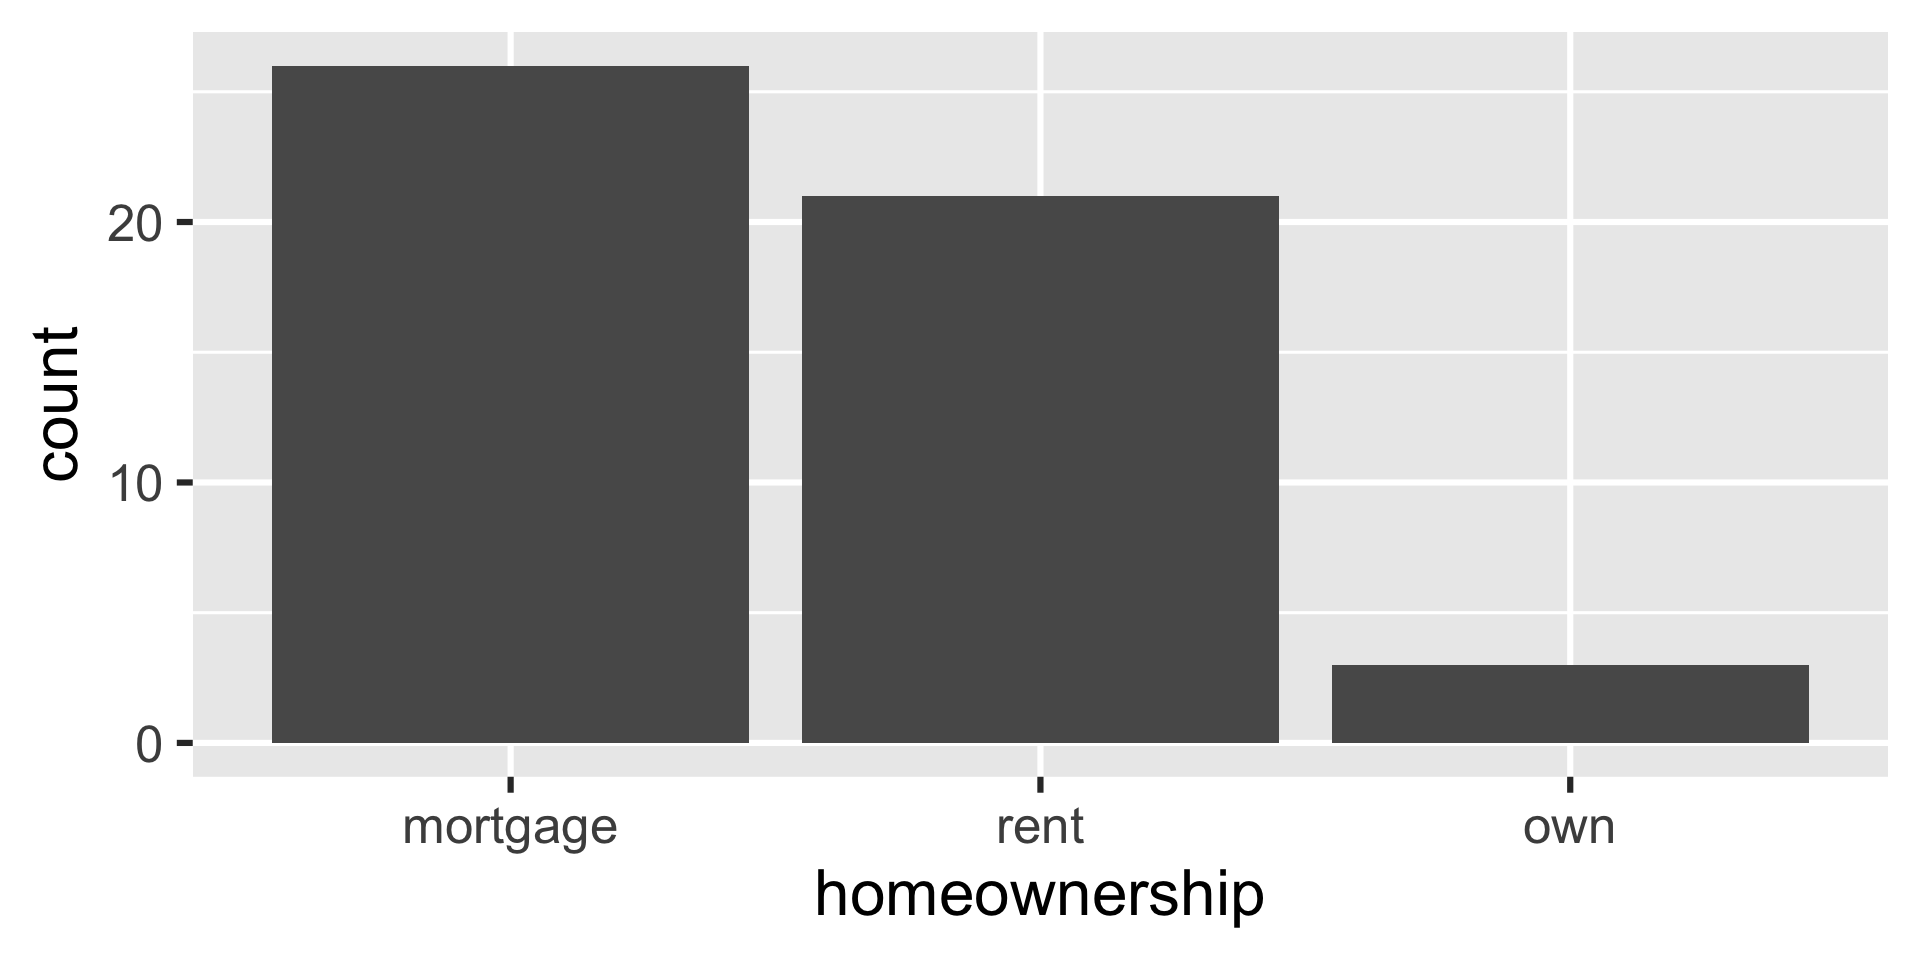
Why is this a bad visualization for the data from lab yesterday?

Scan the QR code or go to app.wooclap.com/sta199. Log in with your Duke NetID.
Participate 📱💻
Scan the QR code or go to app.wooclap.com/sta199. Log in with your Duke NetID.
Aesthetic mappings
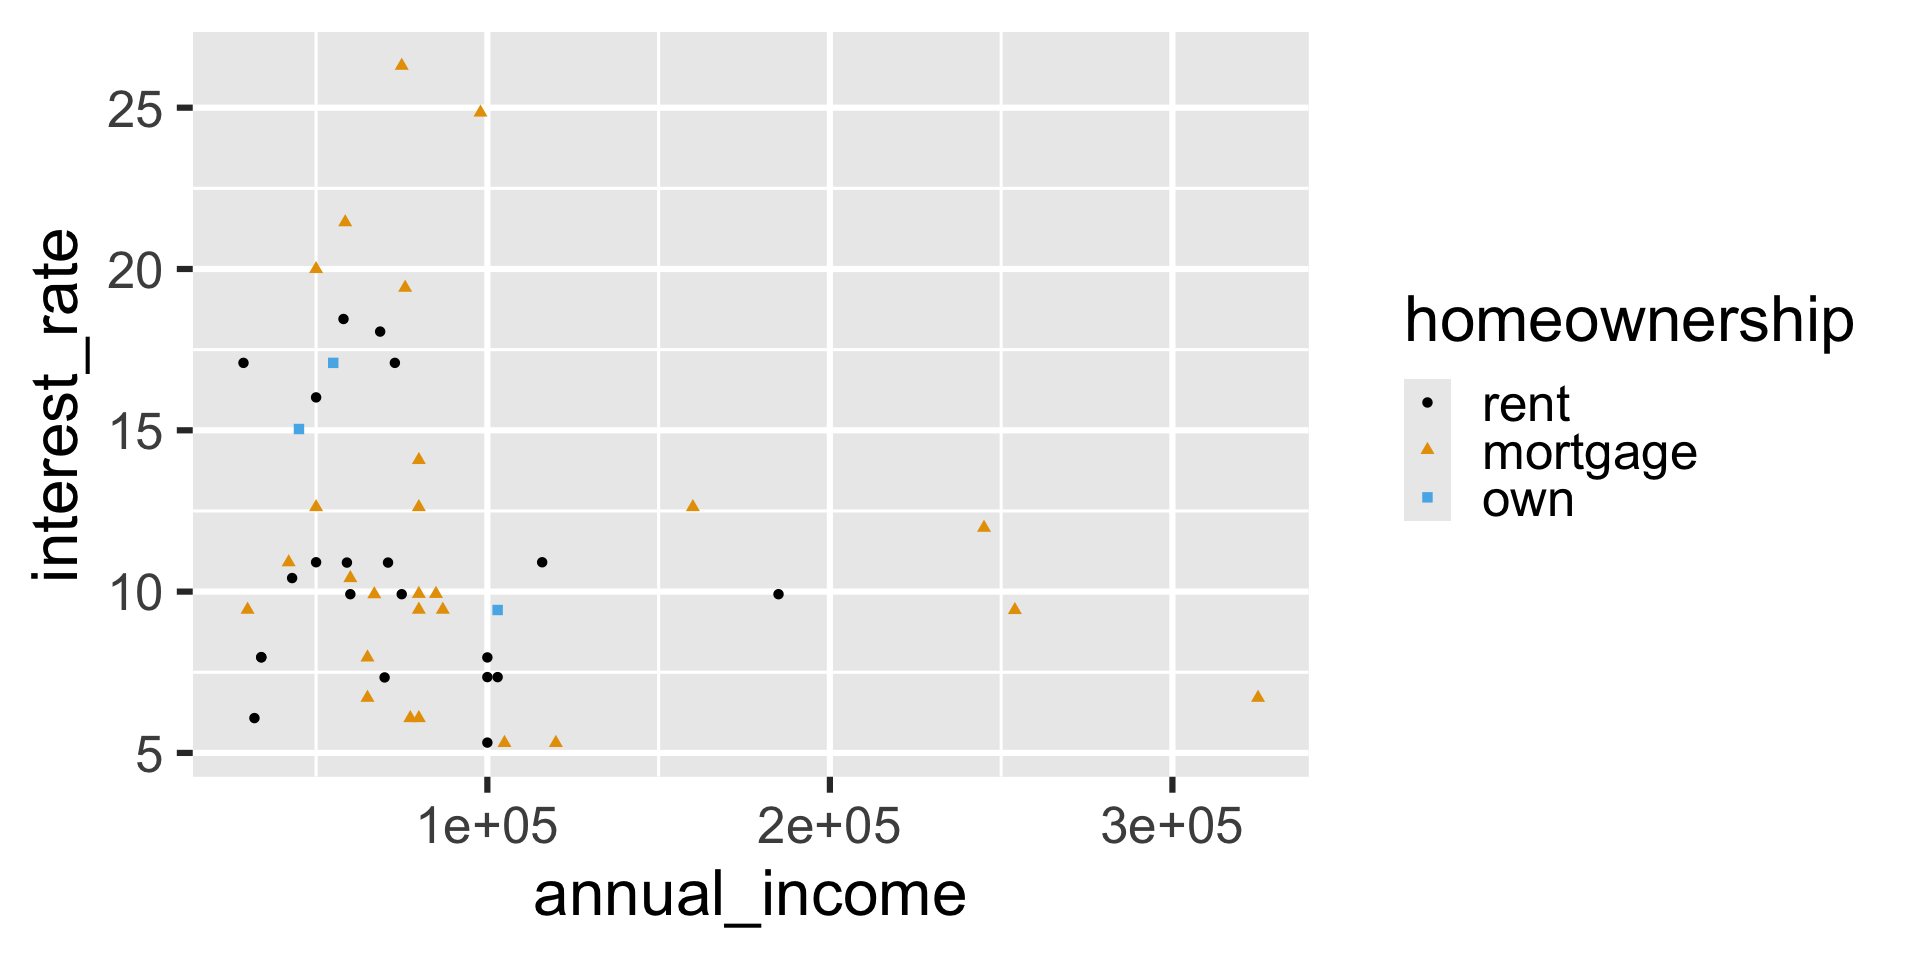
Global mappings
`geom_smooth()` using formula = 'y ~ x'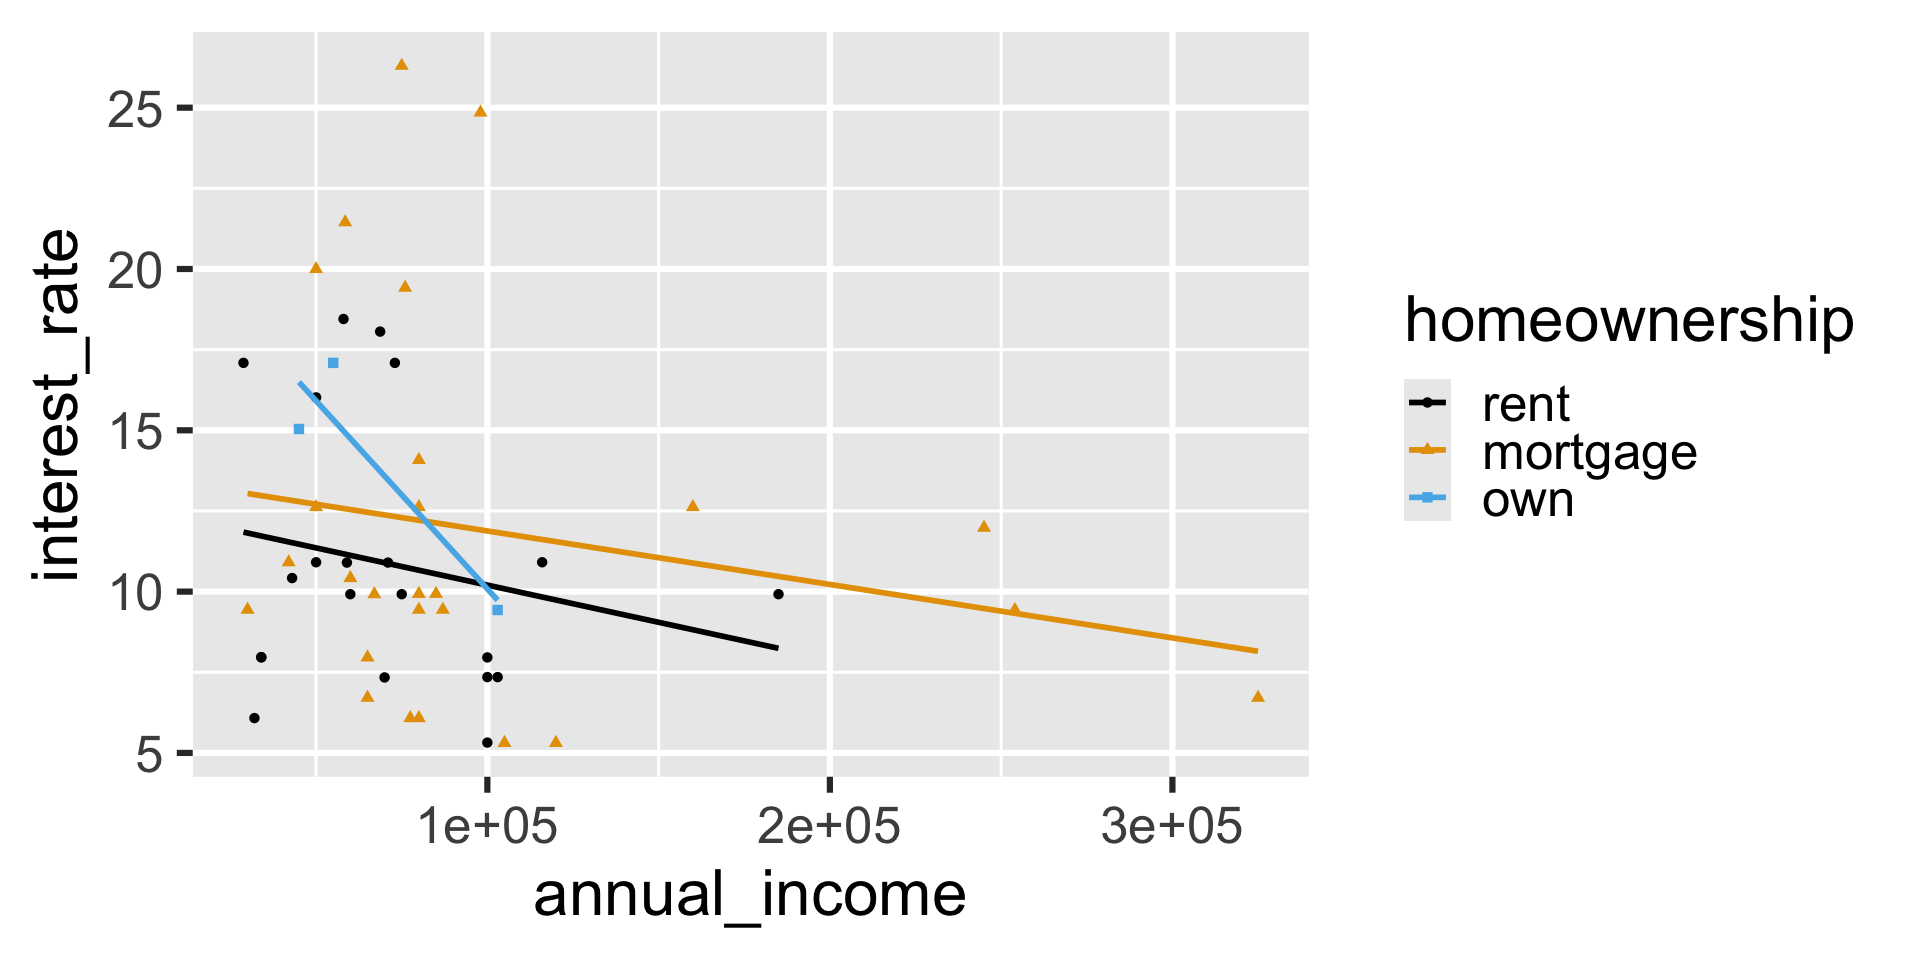
Local mappings
`geom_smooth()` using formula = 'y ~ x'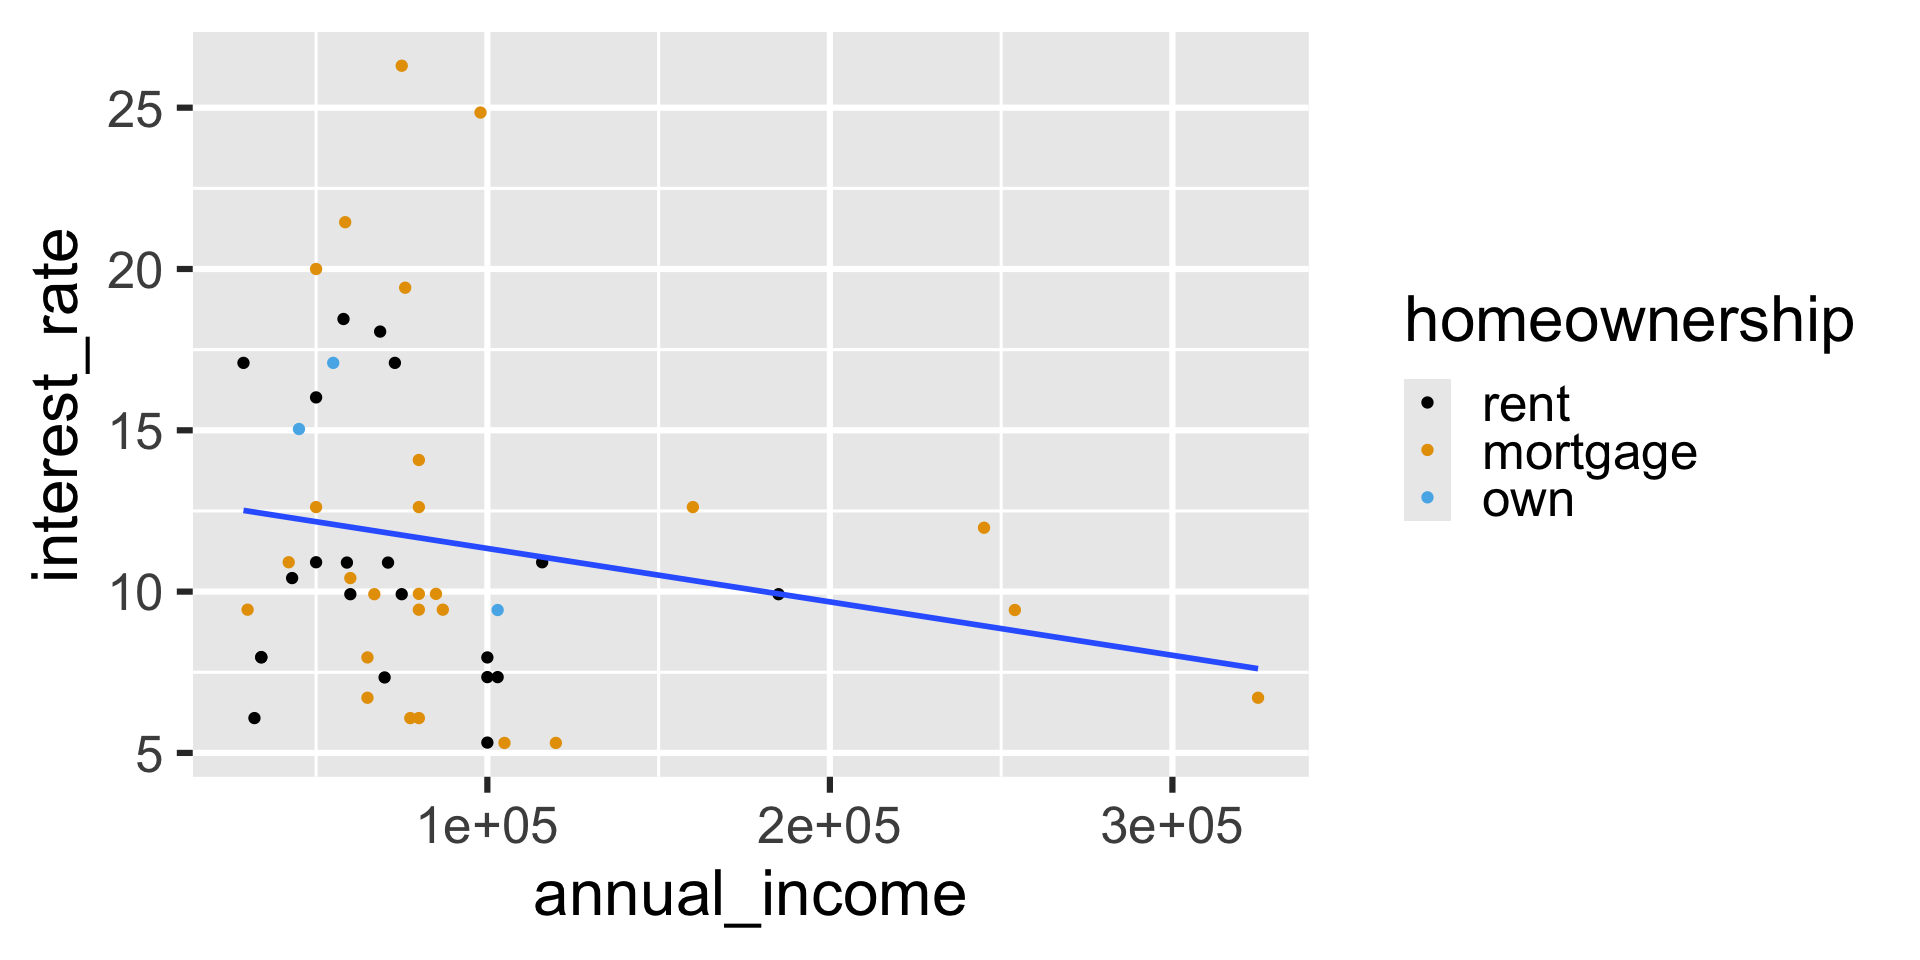
Mapping vs. setting
`geom_smooth()` using formula = 'y ~ x'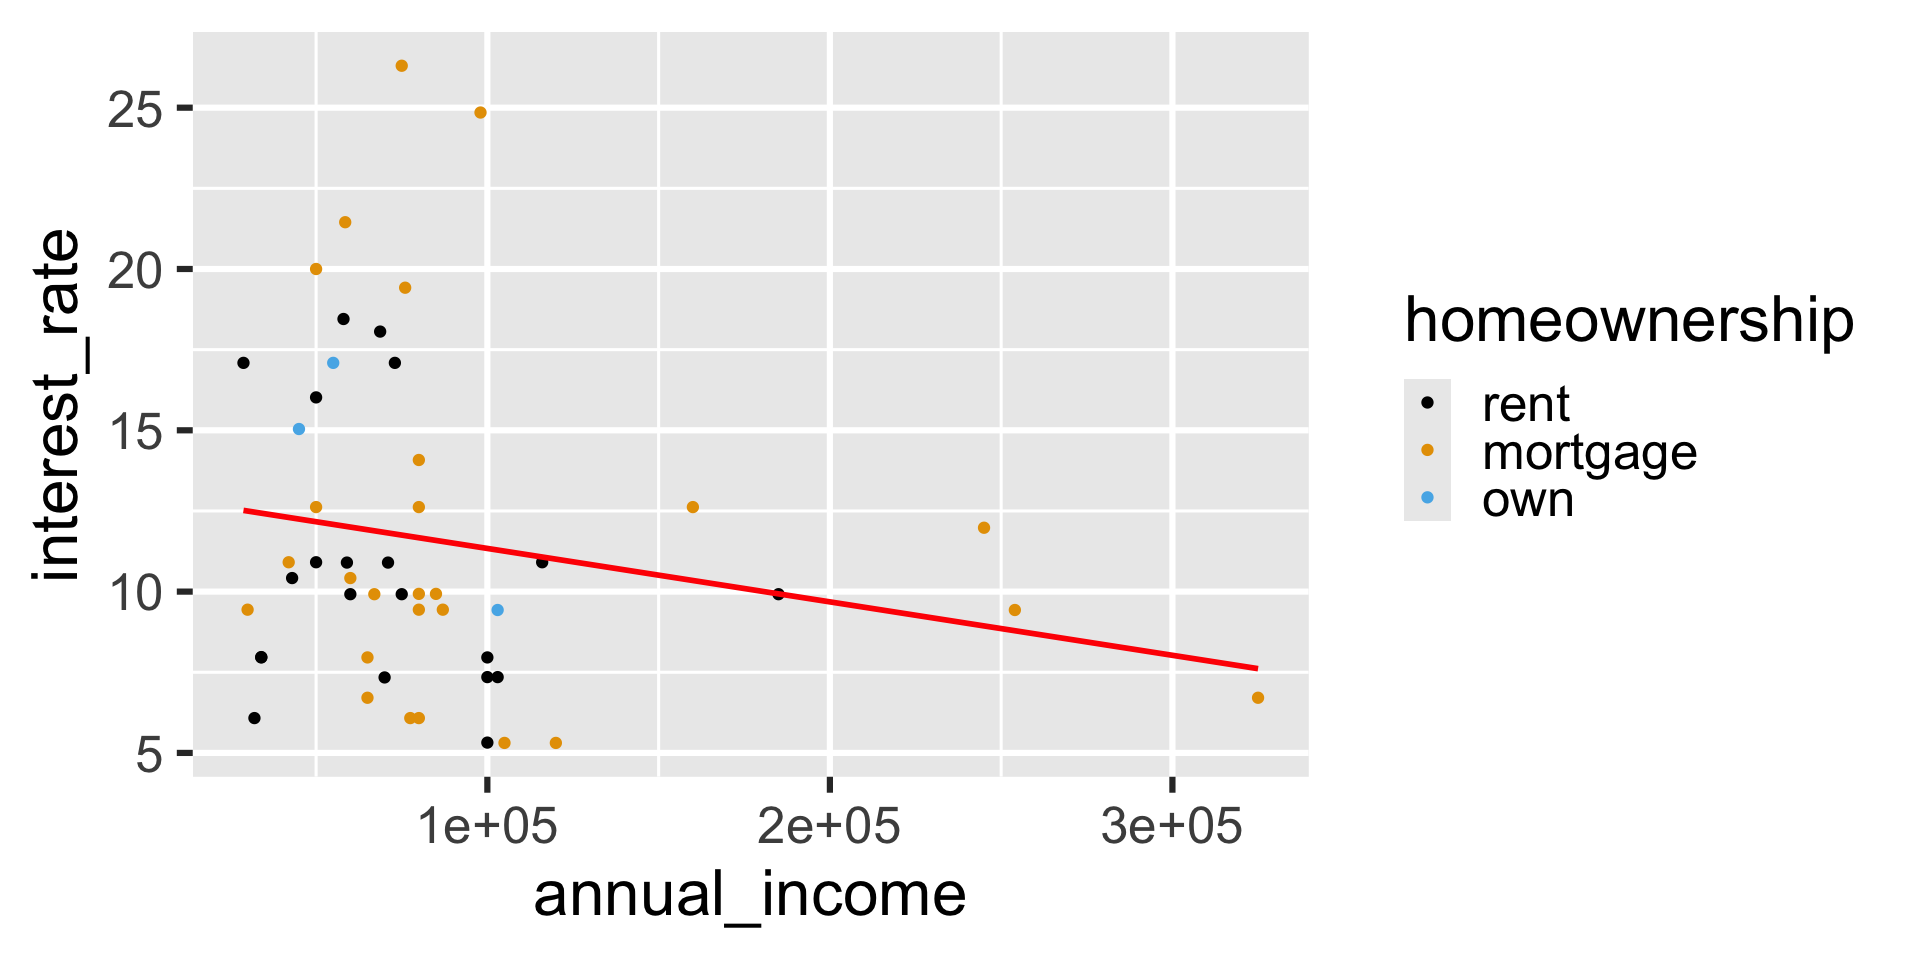
Aside: Legends
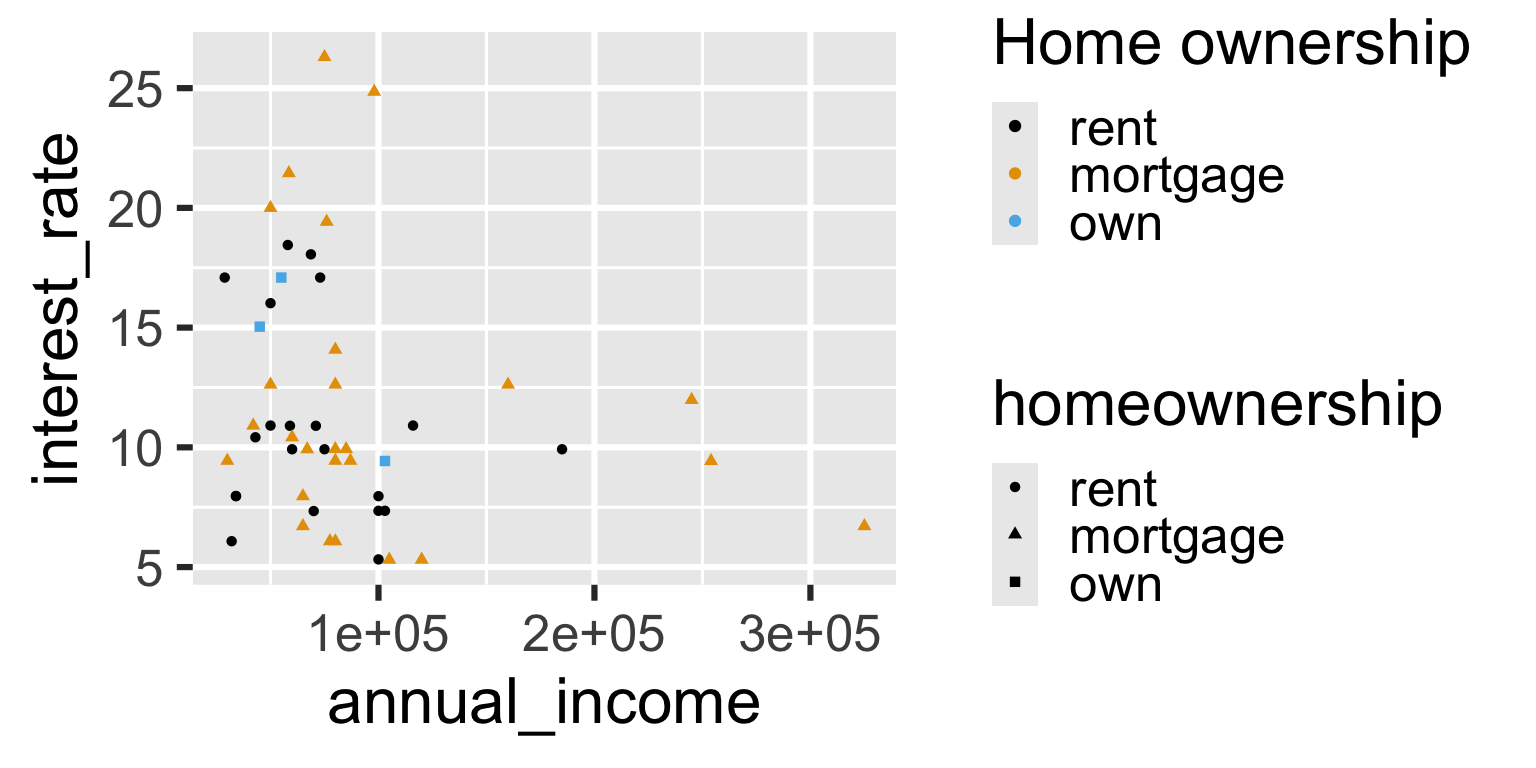
Aside: Legends
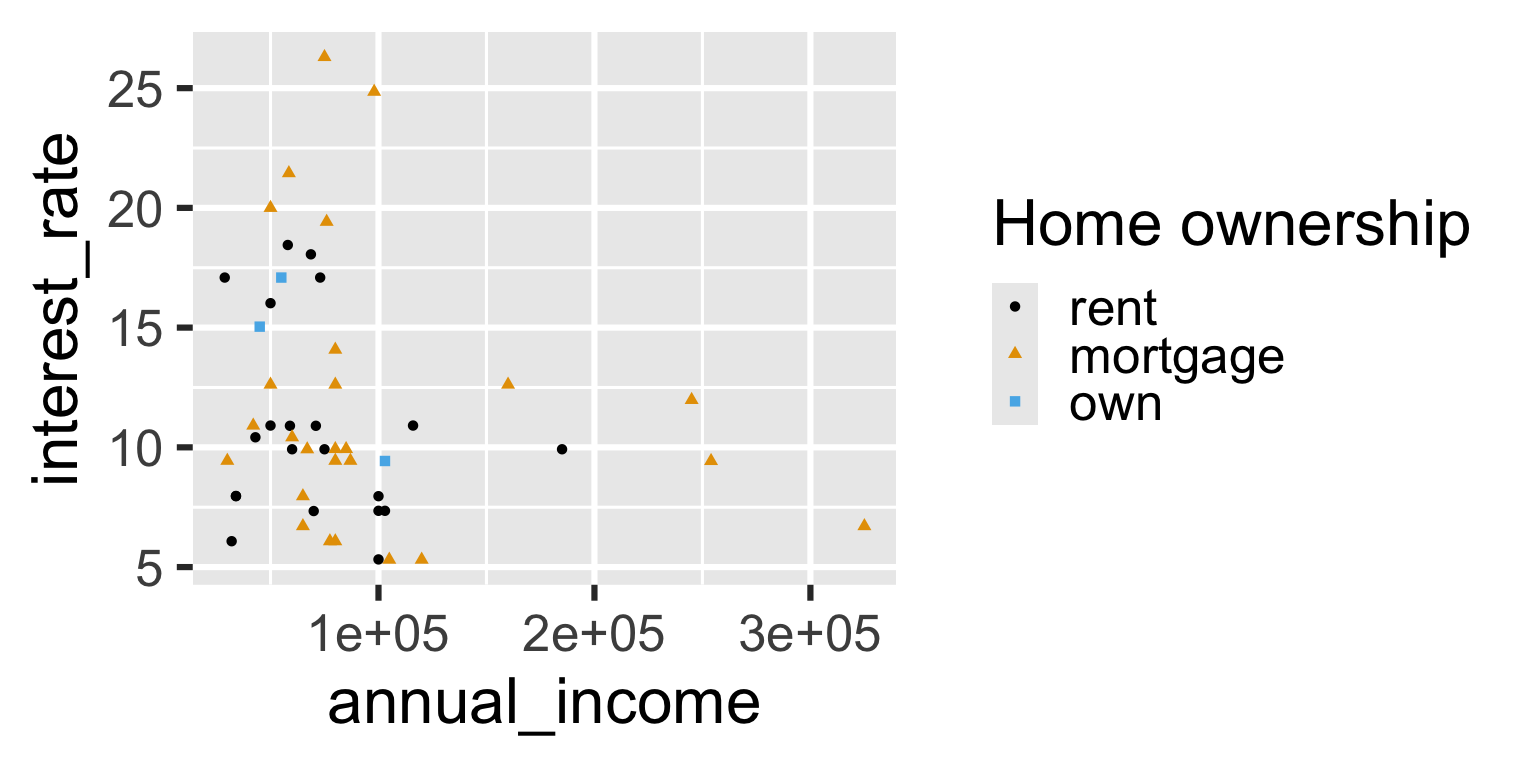
Aside: Legends
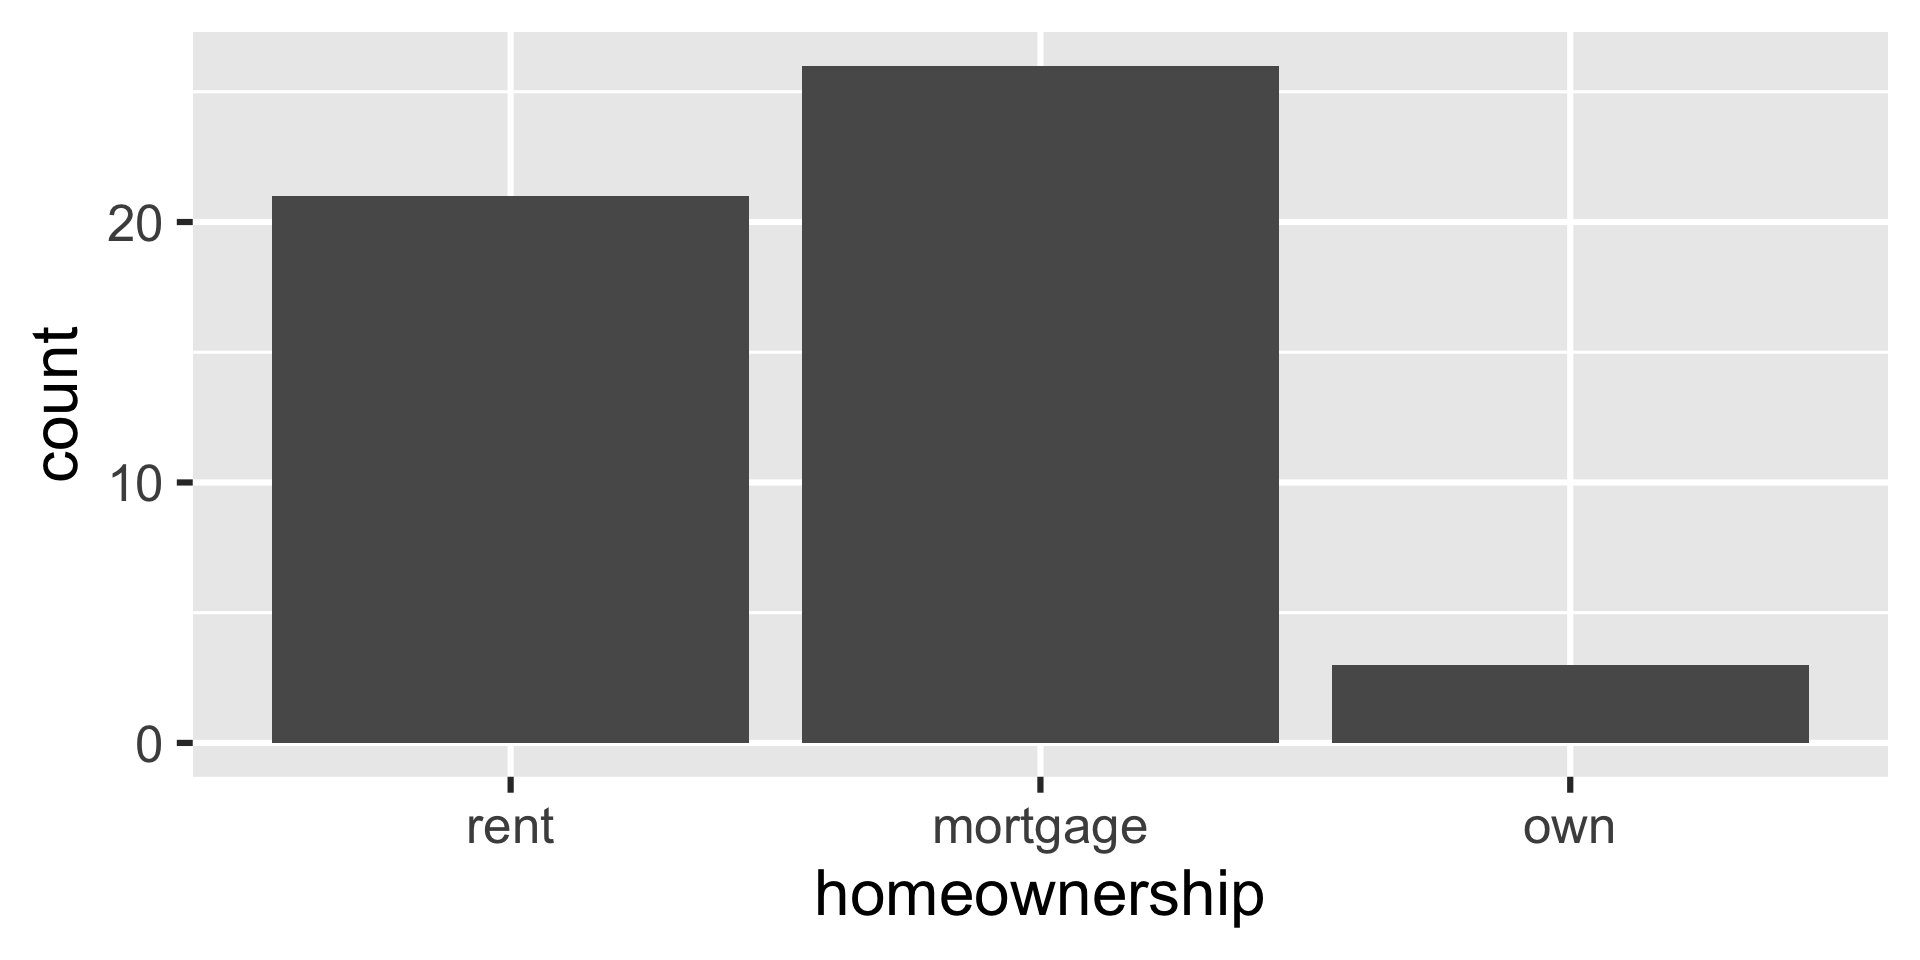
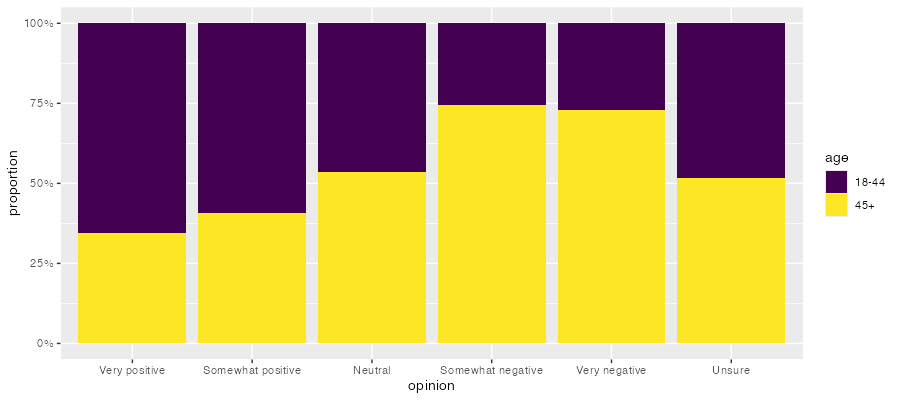
Bar plot
Bar plot - reordered
