Exploratory data analysis II
Lecture 6
September 11, 2025
While you wait: Participate 📱💻
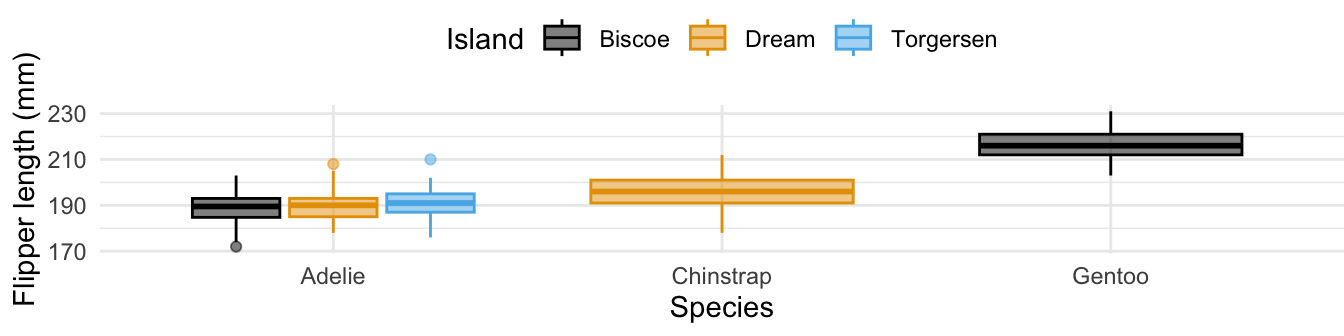
Which of the following is false about the following plot and the code that produced it?

Scan the QR code or go to app.wooclap.com/sta199. Log in with your Duke NetID.
- There are no Chinstrap or Gentoo penguins on Torgersen Island.
-
legend.position = "bottom"is set in thetheme()layer. - The same variable is mapped to both
colorandfill. -
group_by(species)is used to create the boxplots. - A Biscoe island penguin with a flipper length of 190 mm must be an Adélie.
From the AE
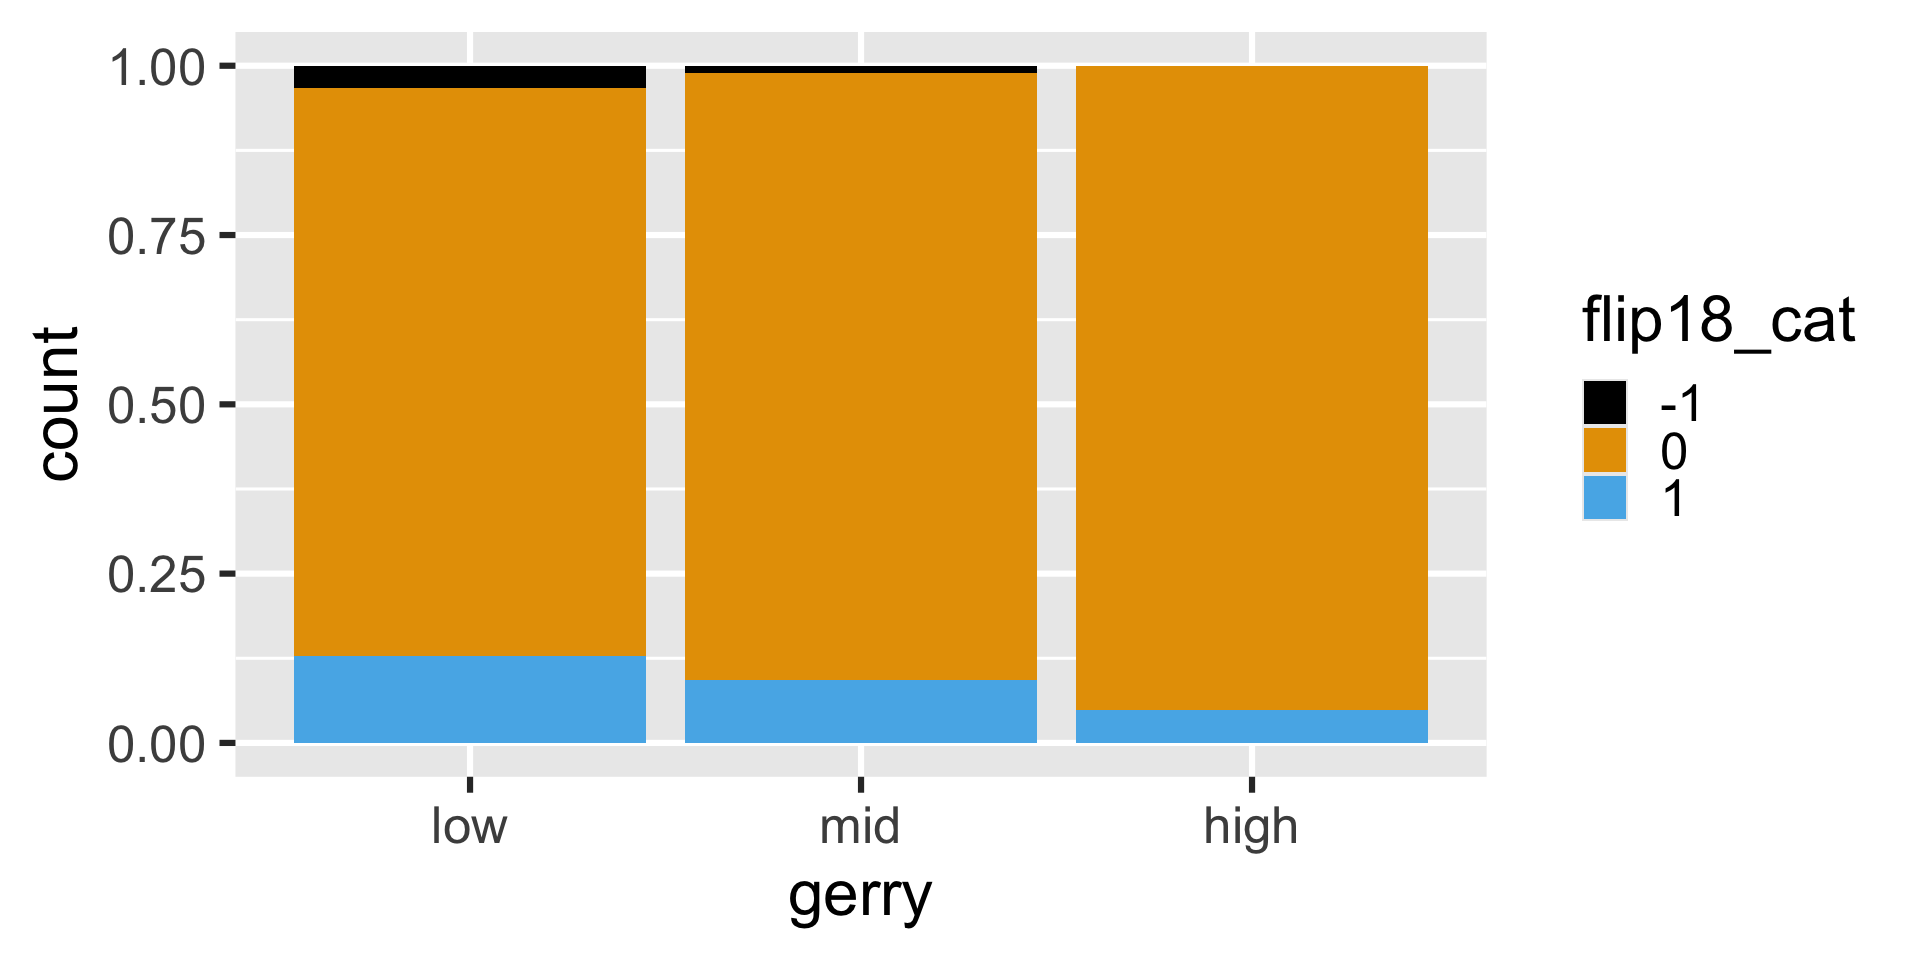
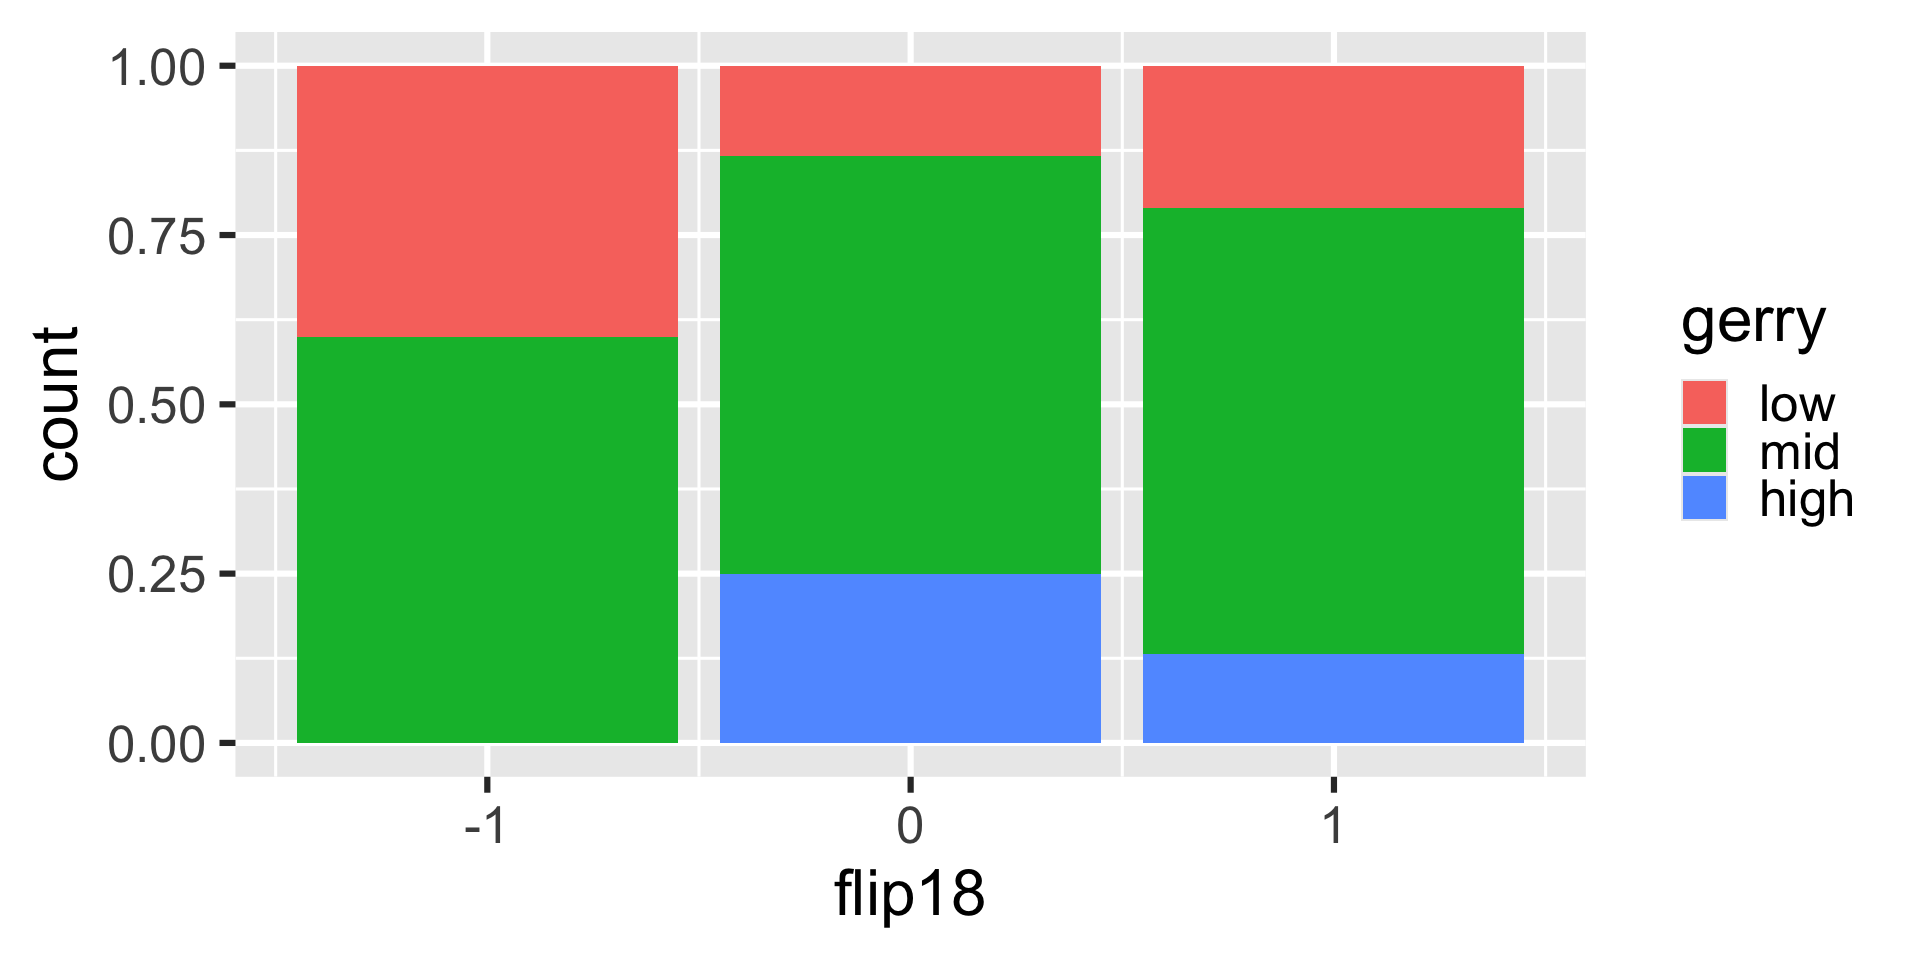
Is a Congressional District more likely to have high prevalence of gerrymandering if a Democrat flipped the seat in the 2018 election? (flip18 = 1: Democrat flipped the seat, 0: No flip, -1: Republican flipped the seat.)
Participate 📱💻
How would you write the following pipeline with count() instead?
# A tibble: 50 × 2
   state     n
   <chr> <int>
 1 CA       53
 2 TX       36
 3 FL       27
 4 NY       27
 5 IL       18
 6 PA       18
 7 OH       16
 8 GA       14
 9 MI       14
10 NC       13
# ℹ 40 more rows
gerrymander |> arrange(state) |> count()gerrymander |> count(state) |> arrange(desc(n))gerrymander |> count(state) |> sort(n)gerrymander |> count(state, sort = TRUE)
Scan the QR code or go to app.wooclap.com/sta199. Log in with your Duke NetID.
What’s going on?
The following code should produce a visualization that answers the question “Is a Congressional District more likely to be flipped to a Democratic seat if it has high or low prevalence of gerrymandering?” However, it produces a warning and an unexpected plot. What’s going on?
Warning: The following aesthetics were dropped during statistical
transformation: fill.
ℹ This can happen when ggplot fails to infer the correct grouping
  structure in the data.
ℹ Did you forget to specify a `group` aesthetic or to convert a
  numerical variable into a factor?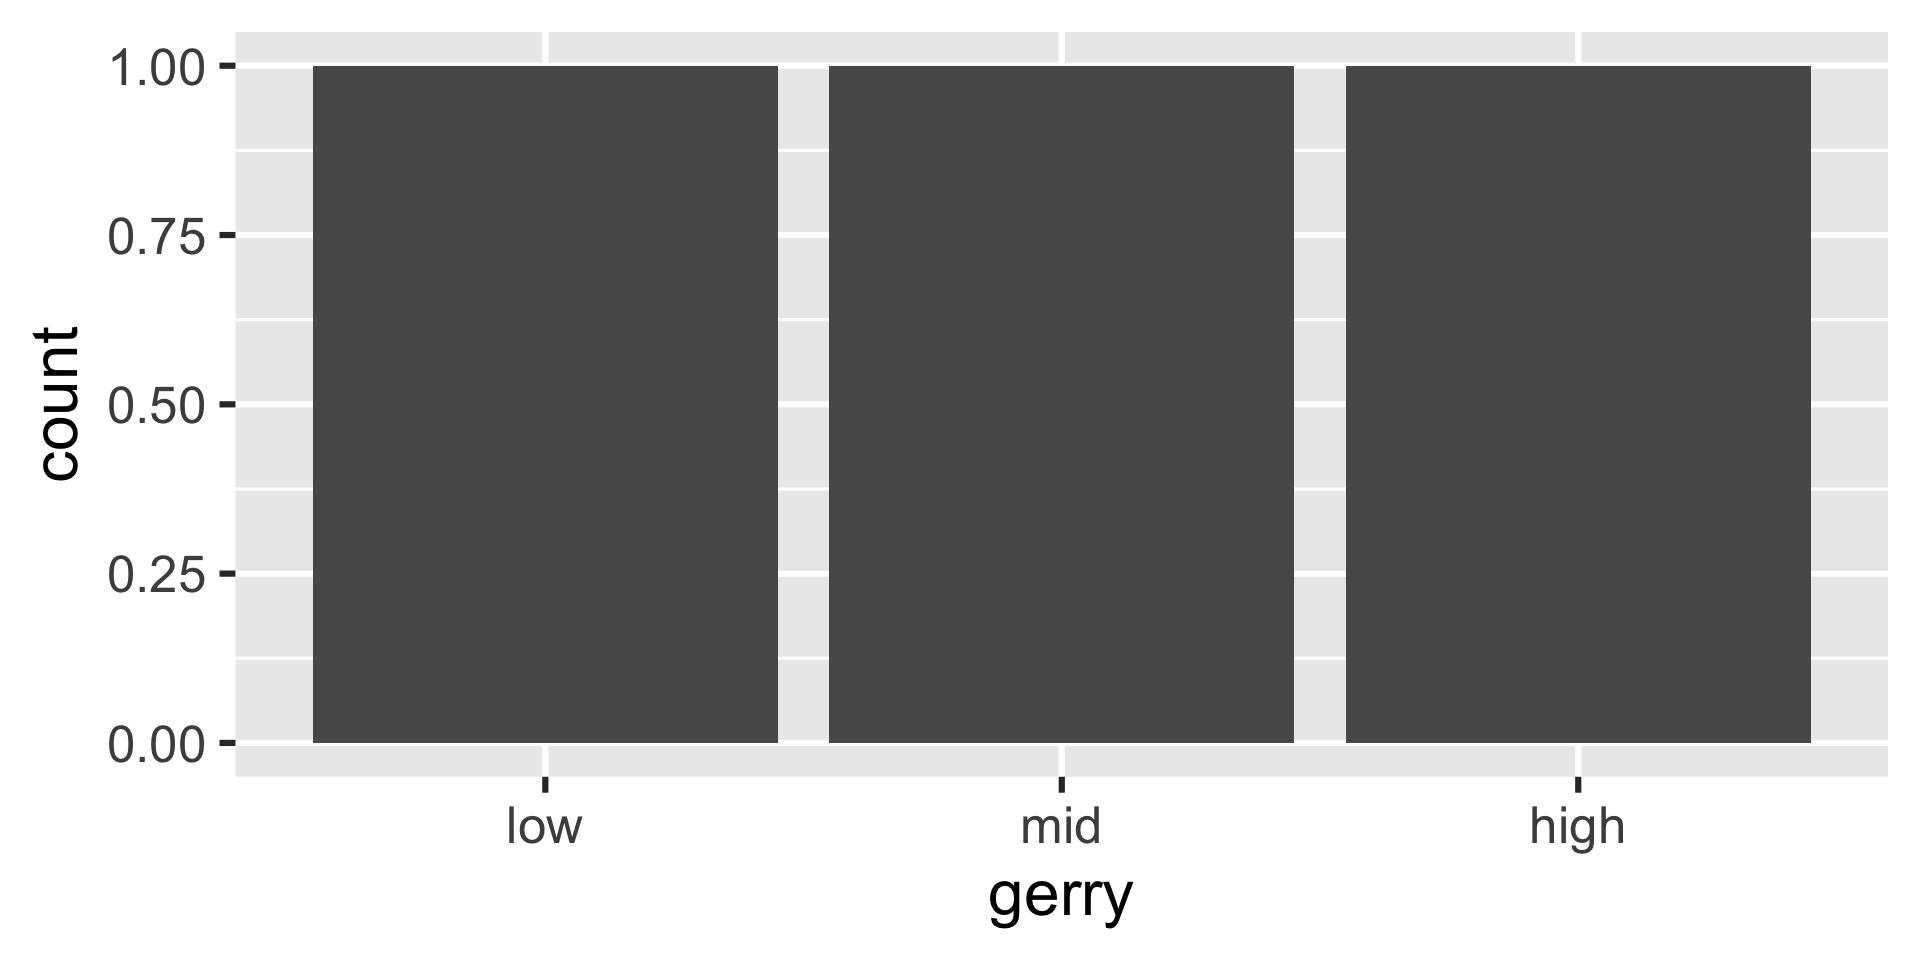
Revisit the plot
Is a Congressional District more likely to be flipped to a Democratic seat if it has high or low prevalence of gerrymandering?