Grammar of data transformation

Lecture 4

Dr. Mine Çetinkaya-Rundel

Duke University
STA 199 - Fall 2025

September 4, 2025

Warm-up

While you wait: Participate 📱💻

Which of the following is true about the code below?

ggplot(mtcars, _[blank]_(x = wt, y = mpg)) +
  geom_point() +
  geom_smooth()
  • mtcars is the name of the variable being plotted on the x-axis
  • The function that goes in the blank is map()
  • The data are being visualized with a scatterplot and a smooth line
  • Some points on the plot will be colored differently than others

Scan the QR code or go to app.wooclap.com/sta199. Log in with your Duke NetID.

Announcements

  • Continue to respond to Wooclap questions during class and remember that attendance and participation are part of your grade – if we haven’t gotten any responses from you yet, and you didn’t just add the class, you’ve already heard from us!

  • Following along with code along videos: See https://sta199-f25.github.io/computing-code-alongs.html – Clone the code-alongs repository and work throgh the relevant .qmd files as you watch the videos. Use the project navigator in RStudio to switch between your code-alongs project and your other projects (ae, labs, HWs, etc.).

  • Lab 1 is on Monday, HW 1 is due next Sunday.

From last time

Bechdel test

The Bechdel test (or the Bechdel-Wallace test), named after cartoonist Alison Bechdel,

is a measure of the representation of women in film and other fiction. The test asks whether a work features at least two women who have a conversation about something other than a man. Some versions of the test also require that those two women have names.

The origin of the Bechdel test

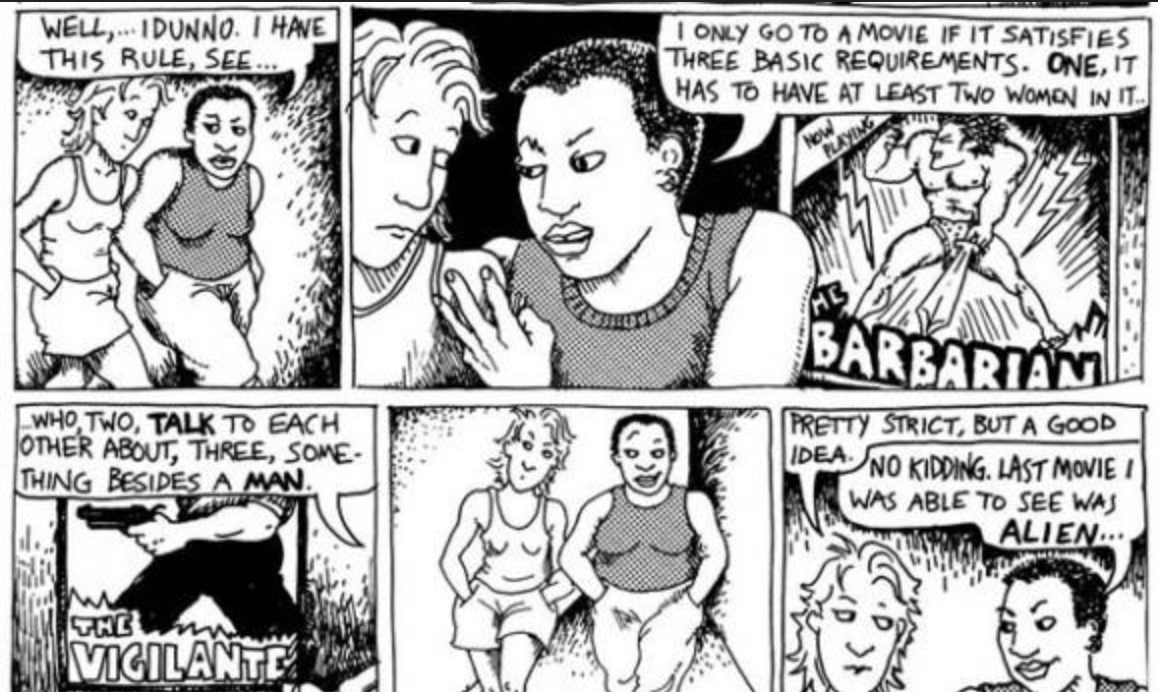
Dykes to Watch Out For - 1985

Film passes if…

  1. two female characters;
  2. talk to each other;
  3. about something besides a man.
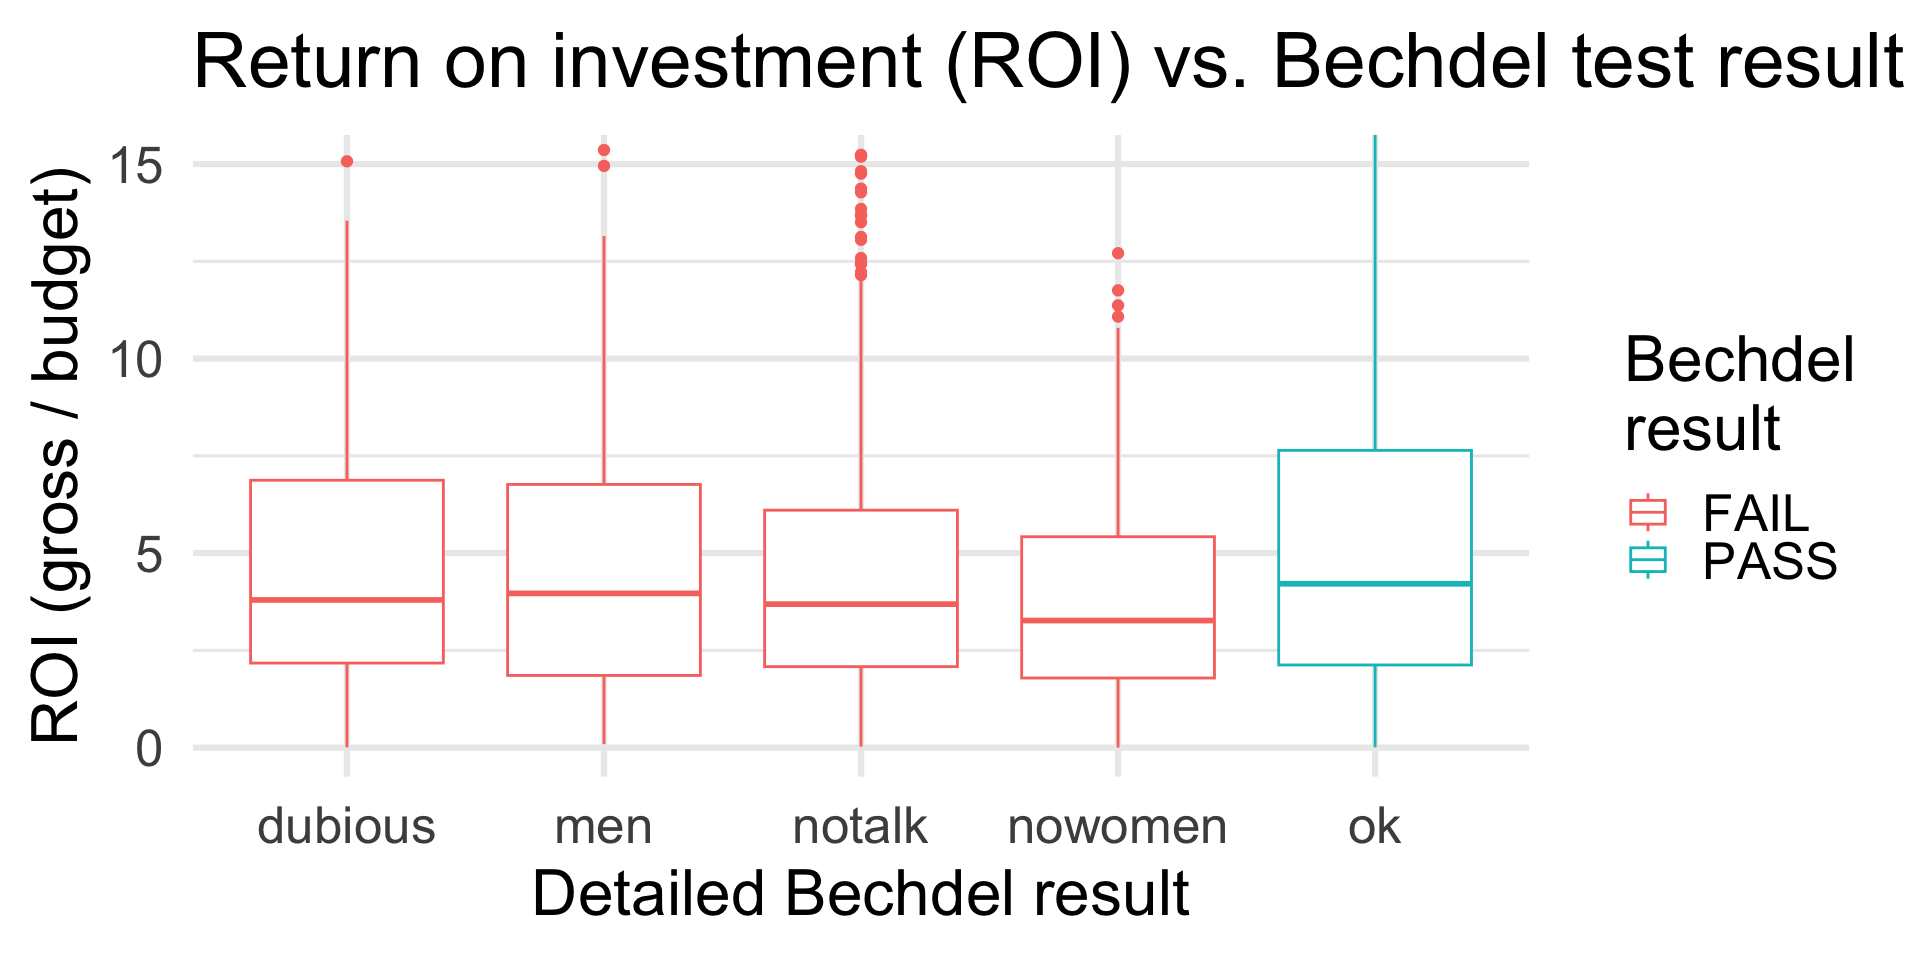
How did some of my favorite movies do?

  • The Big Lebowski ❌
  • In the Mood for Love ✅
  • Trainspotting ❌
  • Love Actually ✅
  • Eternal Sunshine of the Spotless Mind ❌
  • Before Sunrise ❌
  • When Harry Met Sally ✅
  • Garden State ✅
  • Empire Records ✅
  • Amélie ✅

Data story

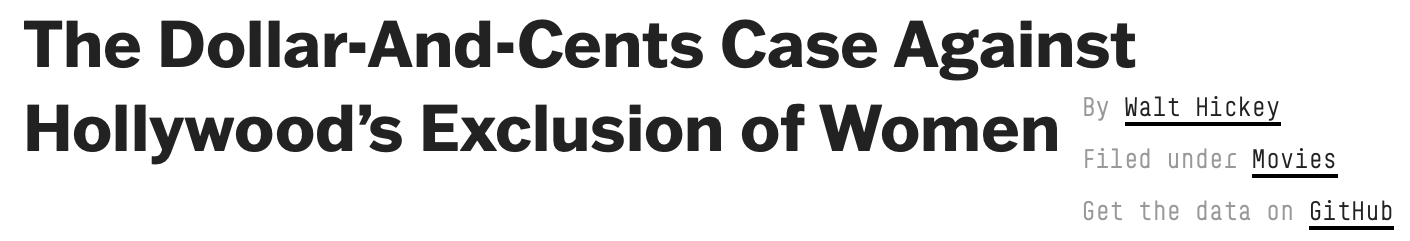
We did a statistical analysis of films to test two claims: first, that films that pass the Bechdel test — featuring women in stronger roles — see a lower return on investment, and second, that they see lower gross profits. We found no evidence to support either claim.

ae-02-bechdel-dataviz

  • Go to your ae project in RStudio.
  • Make sure all of your changes up to this point are committed and pushed, i.e., there’s nothing left in your Git pane.
  • If you haven’t done so during the last class, click Pull to get today’s application exercise file.
  • Work through the application exercise in class, and render, commit, and push your edits by the end of class.

Recap

  • Construct plots with ggplot().
  • Layers of ggplots are separated by +s.
  • The formula is (almost) always as follows:
ggplot(DATA, aes(x = X-VAR, y = Y-VAR, ...)) +
  geom_XXX()

Recap: Code cells (aka code chunks)
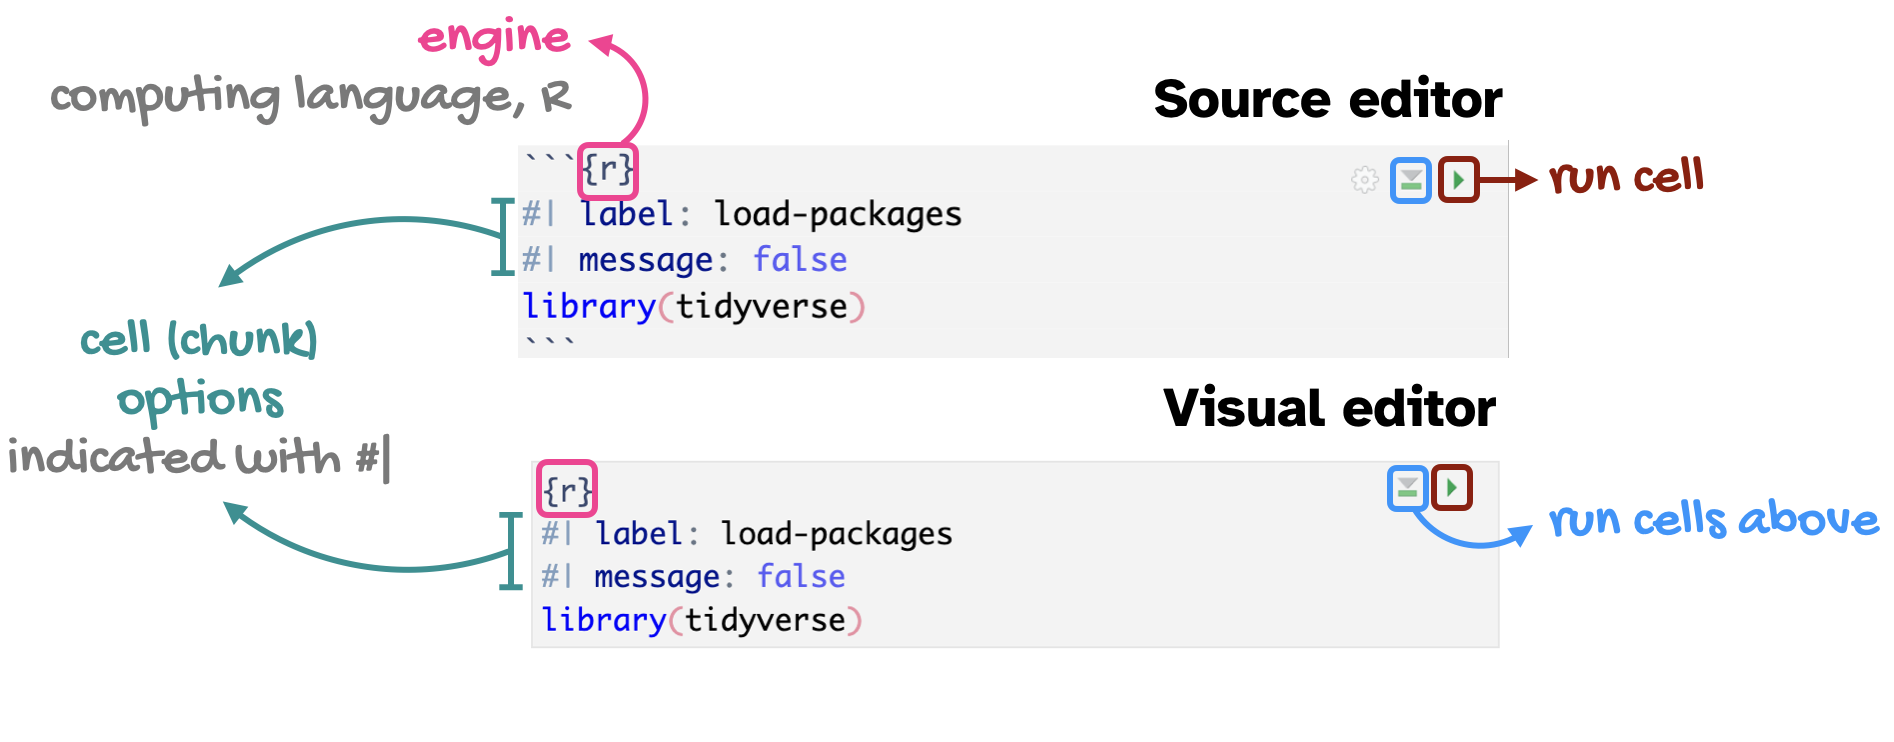
  • Cell labels are helpful for describing what the code is doing, for jumping between code cells in the editor, and for troubleshooting

  • message: false hides any messages emitted by the code in your rendered document

Data transformation

A quick reminder

1bechdel |>
2  filter(roi > 400) |>
3  select(title, roi, budget_2013, gross_2013, year, clean_test)
1
Start with the bechdel data frame
2
Filter for movies with roi greater than 400 (gross is more than 400 times budget)
3
Select the columns title, roi, budget_2013, gross_2013, year, and clean_test
# A tibble: 3 × 6
  title                    roi budget_2013 gross_2013  year clean_test
  <chr>                  <dbl>       <dbl>      <dbl> <dbl> <chr>     
1 Paranormal Activity     671.      505595  339424558  2007 dubious   
2 The Blair Witch Proje…  648.      839077  543776715  1999 ok        
3 El Mariachi             583.       11622    6778946  1992 nowomen   

Participate 📱💻

In data transformation with the pipe operator |>, what does the operator do?

  • It ends a pipeline and prints the result.
  • It joins two data frames together.
  • It passes the output from the previous command into the first argument of the function in the next command.
  • It is equivalent to the “or” operator.

Scan the QR code or go to app.wooclap.com/sta199. Log in with your Duke NetID.

The pipe |>

The pipe operator passes what comes before it into the function that comes after it as the first argument in that function.

sum(1, 2)
[1] 3
1 |> 
  sum(2)
[1] 3


select(filter(bechdel, roi > 400), title)
# A tibble: 3 × 1
  title                  
  <chr>                  
1 Paranormal Activity    
2 The Blair Witch Project
3 El Mariachi            
bechdel |>
  filter(roi > 400) |>
  select(title)
# A tibble: 3 × 1
  title                  
  <chr>                  
1 Paranormal Activity    
2 The Blair Witch Project
3 El Mariachi            

Code style tip

  • In data transformation pipelines, always use a
    • space before |>
    • line break after |>
    • indent the next line of code
  • In data visualization layers, always use a
    • space before +
    • line break after +
    • indent the next line of code

The pipe, in action

Find movies that pass the Bechdel test and display their titles and ROIs in descending order of ROI.

Start with the bechdel data frame:

bechdel
# A tibble: 1,615 × 7
   title          year gross_2013 budget_2013    roi binary clean_test
   <chr>         <dbl>      <dbl>       <dbl>  <dbl> <chr>  <chr>     
 1 21 & Over      2013   67878146    13000000  5.22  FAIL   notalk    
 2 Dredd 3D       2012   55078343    45658735  1.21  PASS   ok        
 3 12 Years a S…  2013  211714070    20000000 10.6   FAIL   notalk    
 4 2 Guns         2013  208105475    61000000  3.41  FAIL   notalk    
 5 42             2013  190040426    40000000  4.75  FAIL   men       
 6 47 Ronin       2013  184166317   225000000  0.819 FAIL   men       
 7 A Good Day t…  2013  371598396    92000000  4.04  FAIL   notalk    
 8 About Time     2013  102648667    12000000  8.55  PASS   ok        
 9 Admission      2013   36014634    13000000  2.77  PASS   ok        
10 After Earth    2013  304895295   130000000  2.35  FAIL   notalk    
# ℹ 1,605 more rows

The pipe, in action

Find movies that pass the Bechdel test and display their titles and ROIs in descending order of ROI.

Filter for rows where binary is equal to "PASS":

bechdel |>
  filter(binary == "PASS")
# A tibble: 753 × 7
   title           year gross_2013 budget_2013   roi binary clean_test
   <chr>          <dbl>      <dbl>       <dbl> <dbl> <chr>  <chr>     
 1 Dredd 3D        2012   55078343    45658735  1.21 PASS   ok        
 2 About Time      2013  102648667    12000000  8.55 PASS   ok        
 3 Admission       2013   36014634    13000000  2.77 PASS   ok        
 4 American Hust…  2013  397915817    40000000  9.95 PASS   ok        
 5 August: Osage…  2013   87609748    25000000  3.50 PASS   ok        
 6 Beautiful Cre…  2013   75392809    50000000  1.51 PASS   ok        
 7 Blue Jasmine    2013  101793664    18000000  5.66 PASS   ok        
 8 Carrie          2013  120268278    30000000  4.01 PASS   ok        
 9 Despicable Me…  2013 1338831390    76000000 17.6  PASS   ok        
10 Elysium         2013  379242208   120000000  3.16 PASS   ok        
# ℹ 743 more rows

The pipe, in action

Find movies that pass the Bechdel test and display their titles and ROIs in descending order of ROI.

Arrange the rows in descending order of roi:

bechdel |>
  filter(binary == "PASS") |>
  arrange(desc(roi))
# A tibble: 753 × 7
   title           year gross_2013 budget_2013   roi binary clean_test
   <chr>          <dbl>      <dbl>       <dbl> <dbl> <chr>  <chr>     
 1 The Blair Wit…  1999  543776715      839077 648.  PASS   ok        
 2 The Devil Ins…  2012  157289709     1014639 155.  PASS   ok        
 3 My Big Fat Gr…  2002  768922942     6475896 119.  PASS   ok        
 4 Chasing Amy     1997   39417963      362810 109.  PASS   ok        
 5 Slacker         1991    4200140       39349 107.  PASS   ok        
 6 Insidious       2010  164379554     1602348 103.  PASS   ok        
 7 Paranormal Ac…  2010  280159759     3204696  87.4 PASS   ok        
 8 Paranormal Ac…  2011  322170936     5178454  62.2 PASS   ok        
 9 The Last Exor…  2010  118787648     1922817  61.8 PASS   ok        
10 Cinderella      1997  246710482     4208591  58.6 PASS   ok        
# ℹ 743 more rows

The pipe, in action

Find movies that pass the Bechdel test and display their titles and ROIs in descending order of ROI.

Select columns title and roi:

bechdel |>
  filter(binary == "PASS") |>
  arrange(desc(roi)) |>
  select(title, roi)
# A tibble: 753 × 2
   title                      roi
   <chr>                    <dbl>
 1 The Blair Witch Project  648. 
 2 The Devil Inside         155. 
 3 My Big Fat Greek Wedding 119. 
 4 Chasing Amy              109. 
 5 Slacker                  107. 
 6 Insidious                103. 
 7 Paranormal Activity 2     87.4
 8 Paranormal Activity 3     62.2
 9 The Last Exorcism         61.8
10 Cinderella                58.6
# ℹ 743 more rows

In this class, you will…

Build cakes (ggplot)

Stack dolls (pipe |>)

Master these constructs, and everything will be A-Ok!

Looking forward: Describing distributions and relationships

Participate 📱💻

Which type of visualization is useful for comparing distributions across groups?

  • Histogram
  • Line plot
  • Scatterplot
  • Side-by-side boxplots

Scan the QR code or go to app.wooclap.com/sta199. Log in with your Duke NetID.

One numerical variable

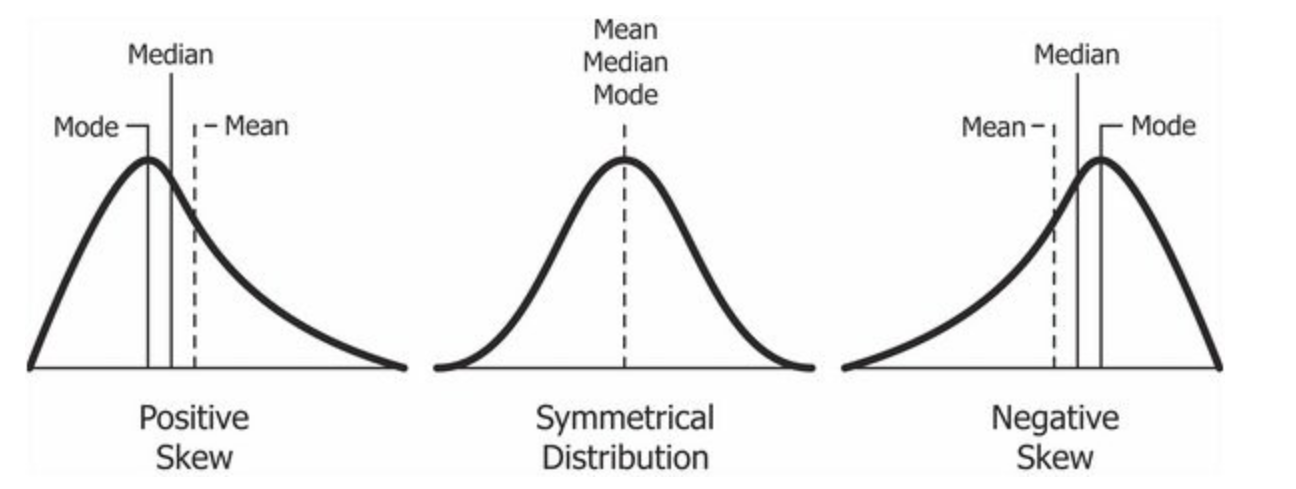
  • Center: What is the “typical” value (mean, median, mode) the data are concentrating around?
  • Spread: How concentrated are the data around a typical value?
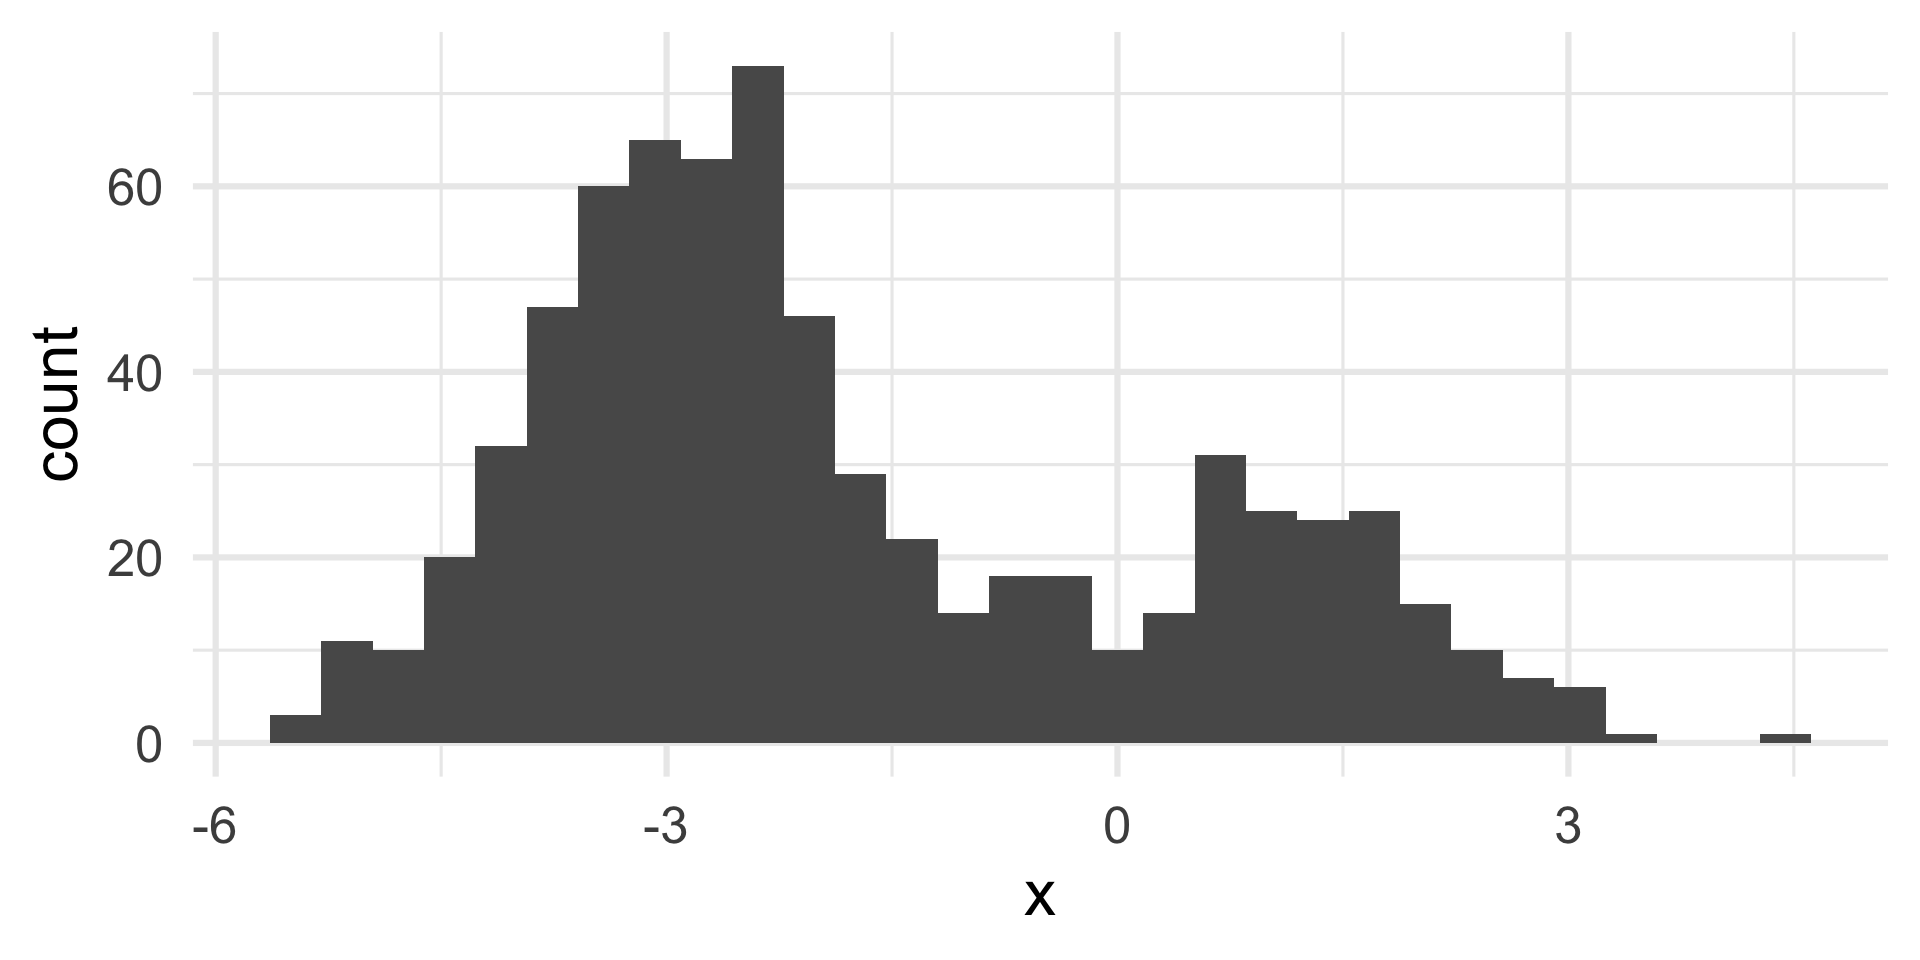
  • Shape: Does the distribution have one peak, or many? is it symmetric or skewed?
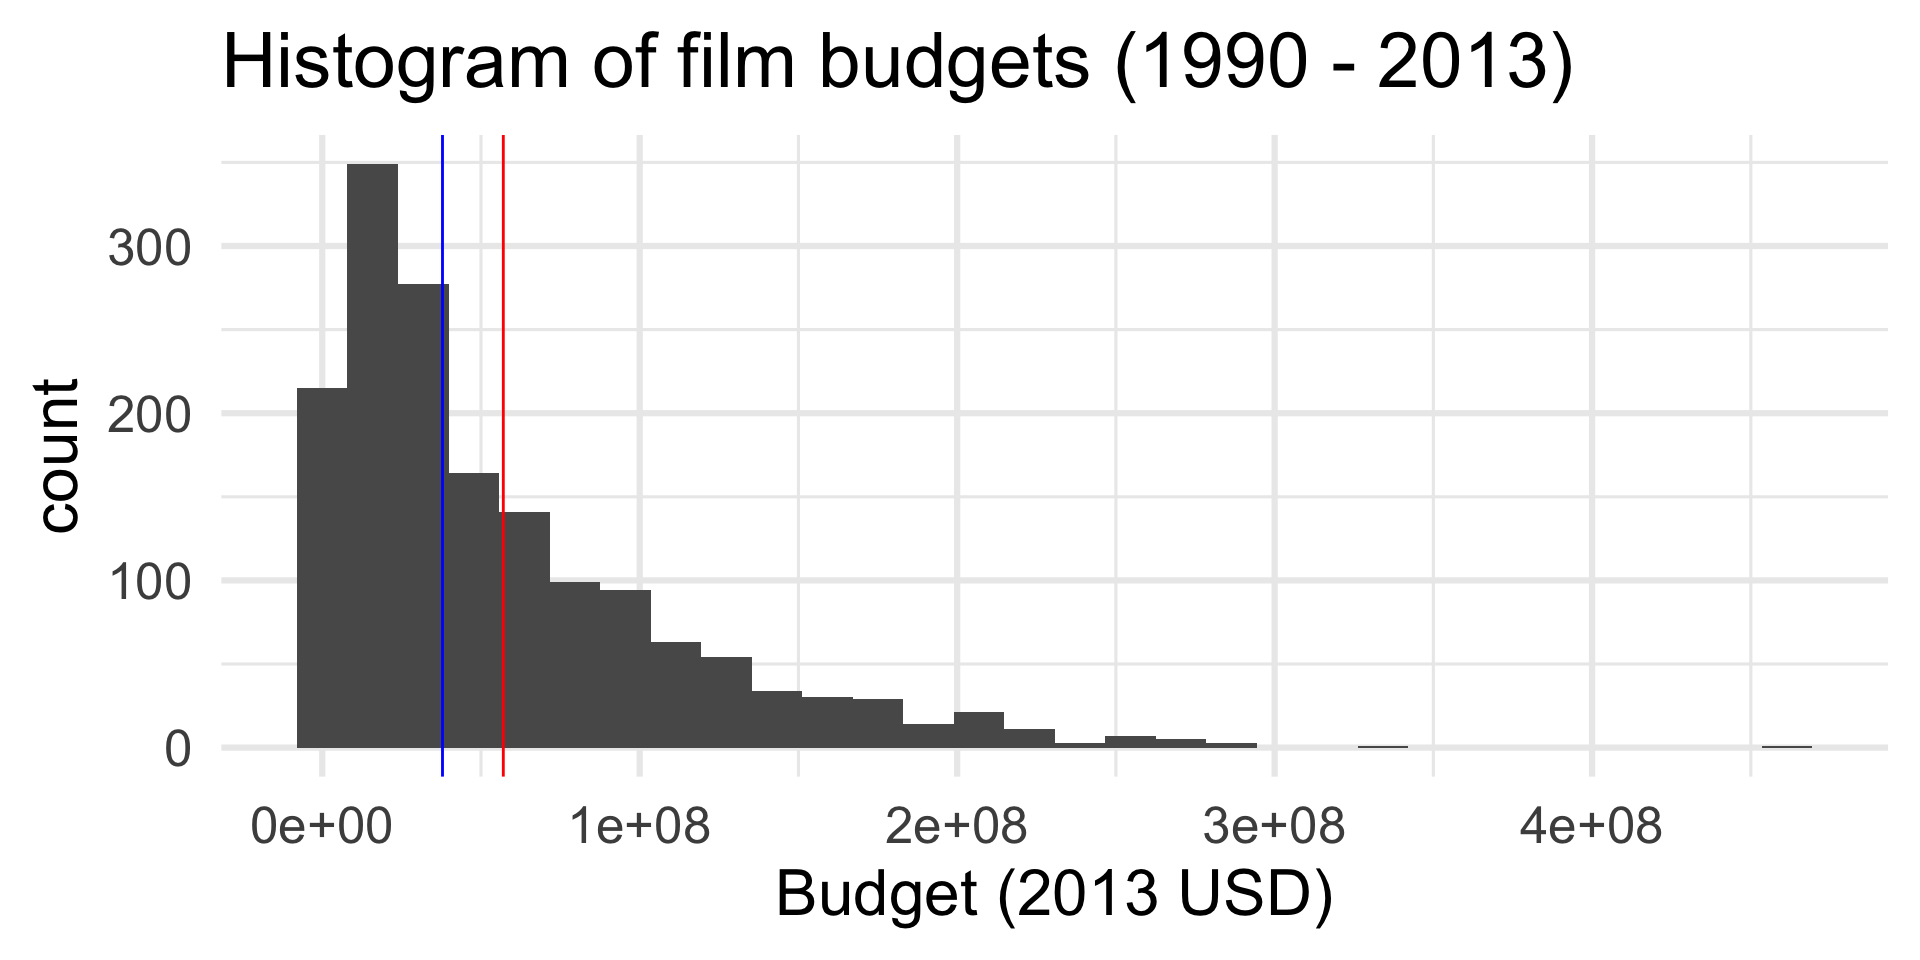
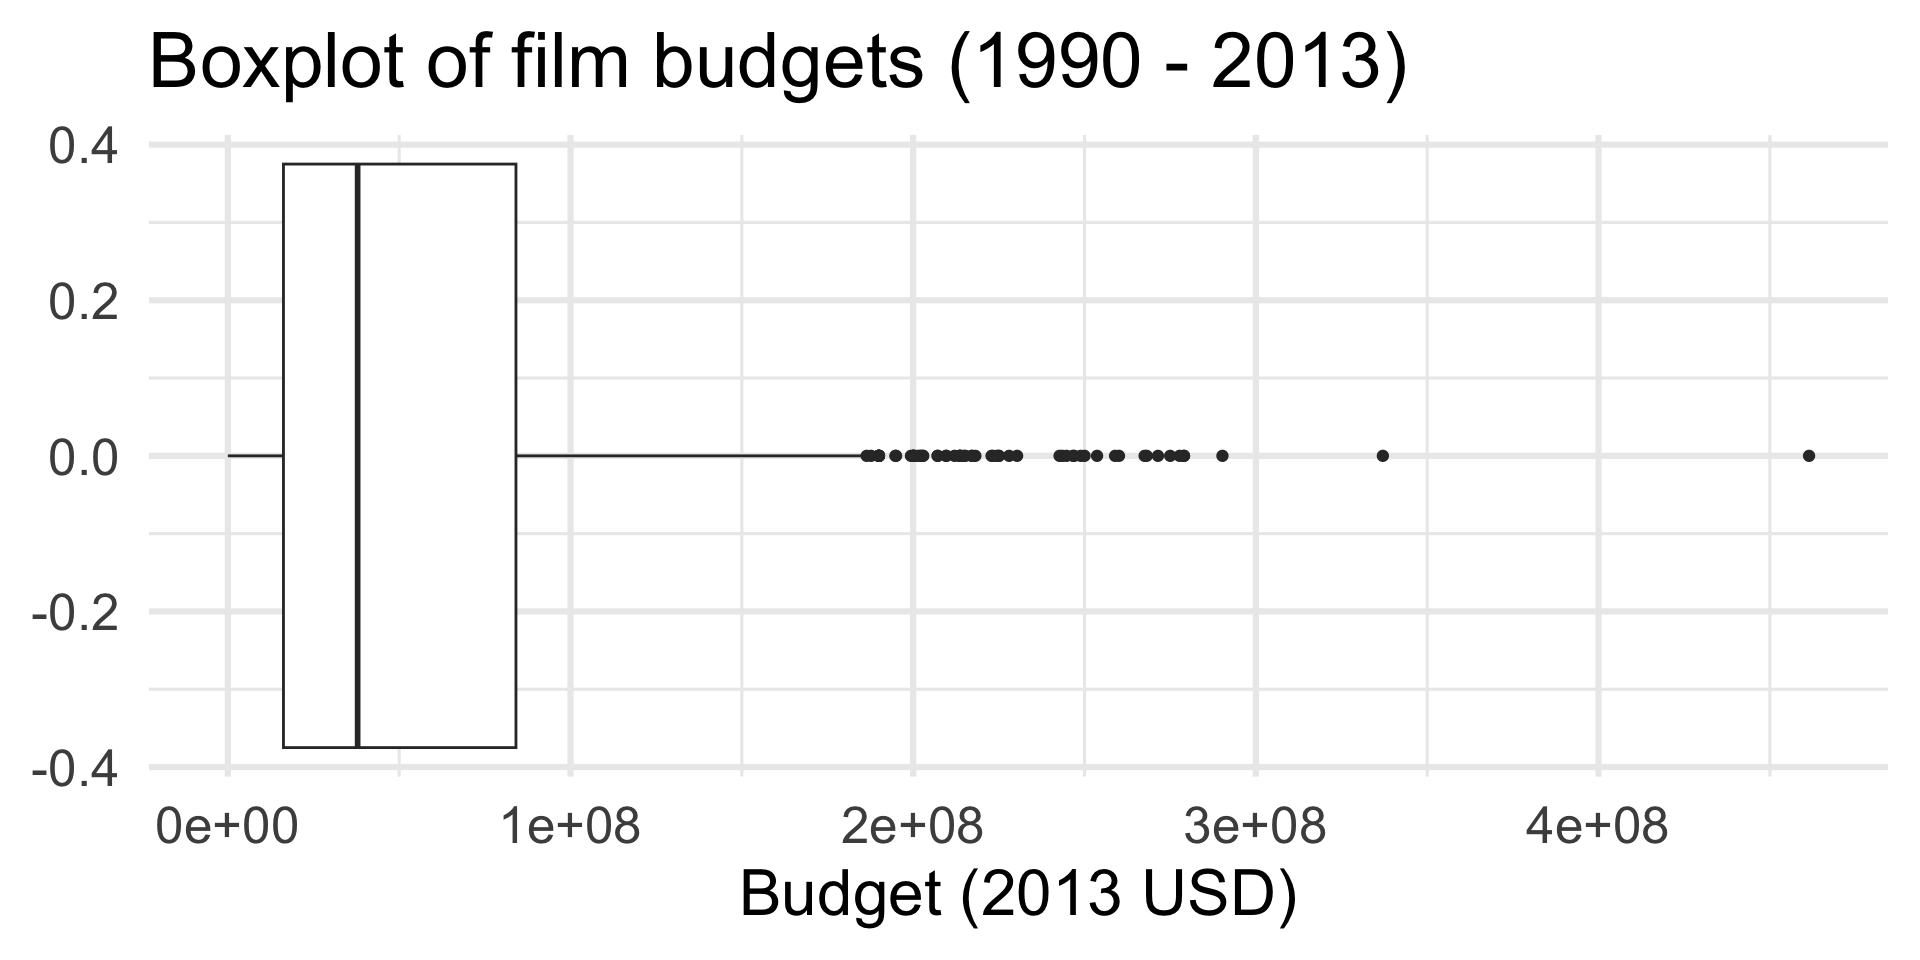
Shape vs. center

Histograms provide more detail…

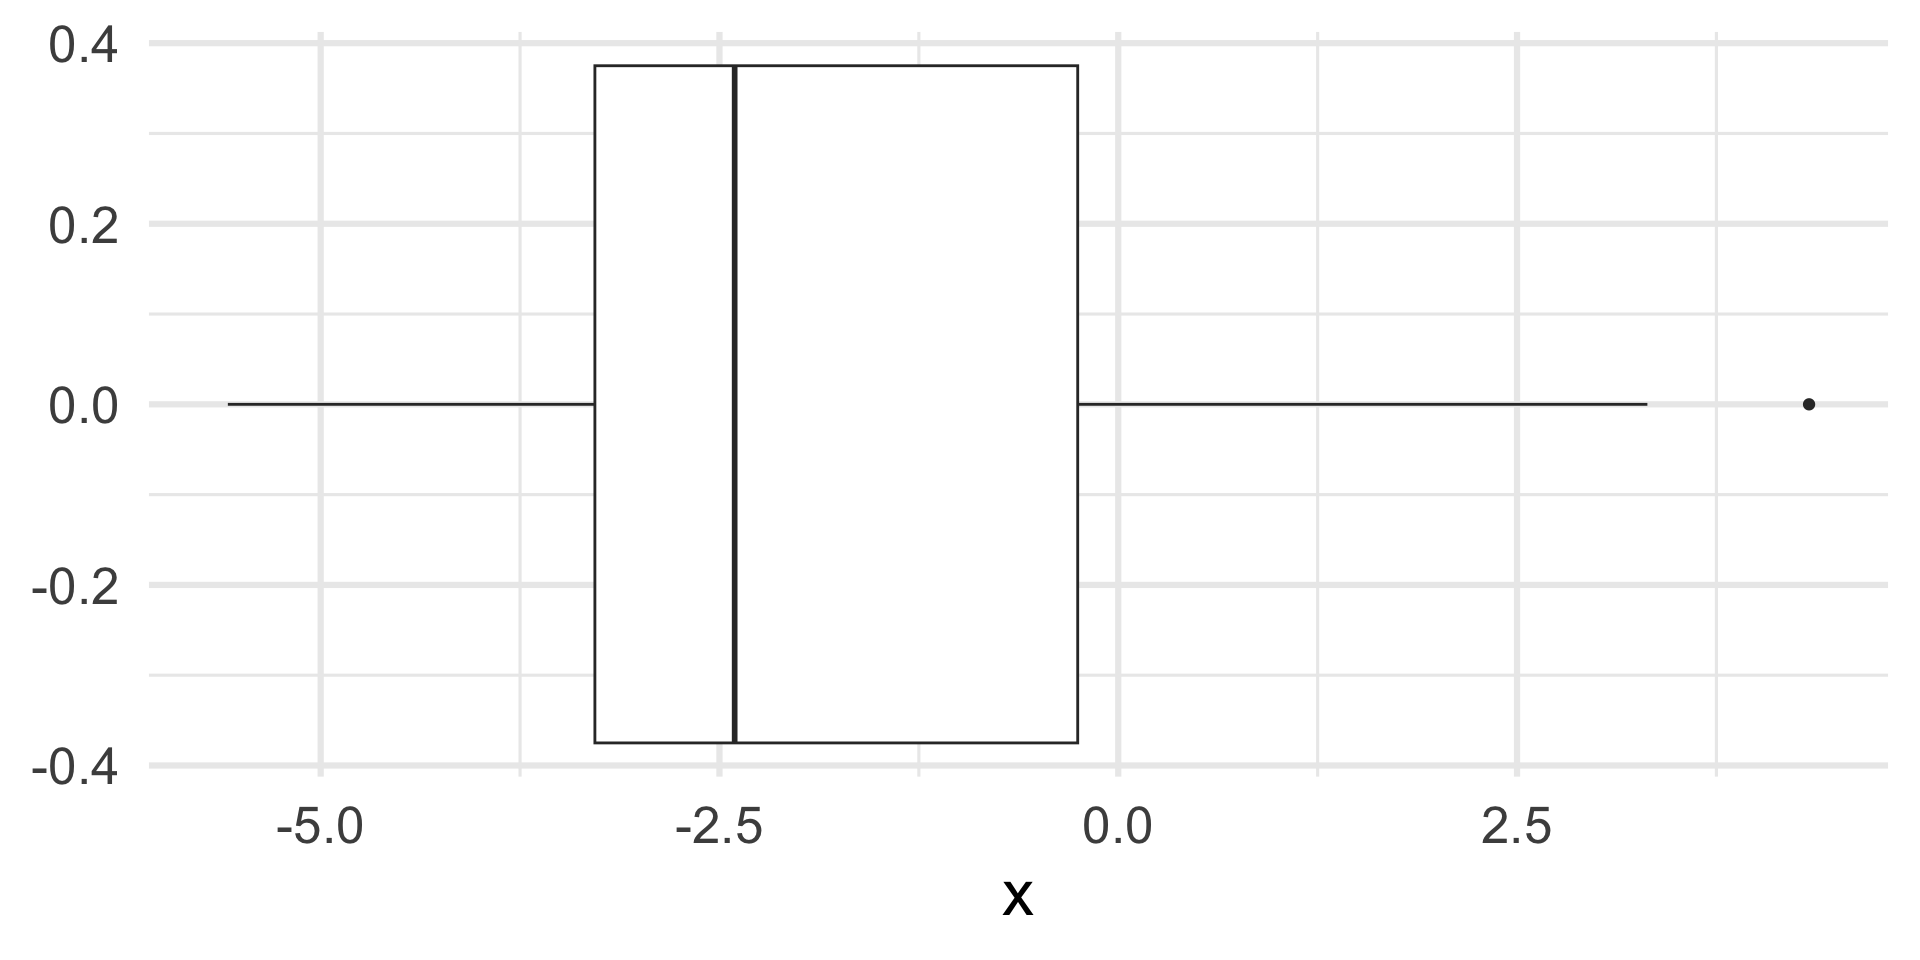
…but boxplots are nice for side-by-side comparisons

Talking about two numerical variables

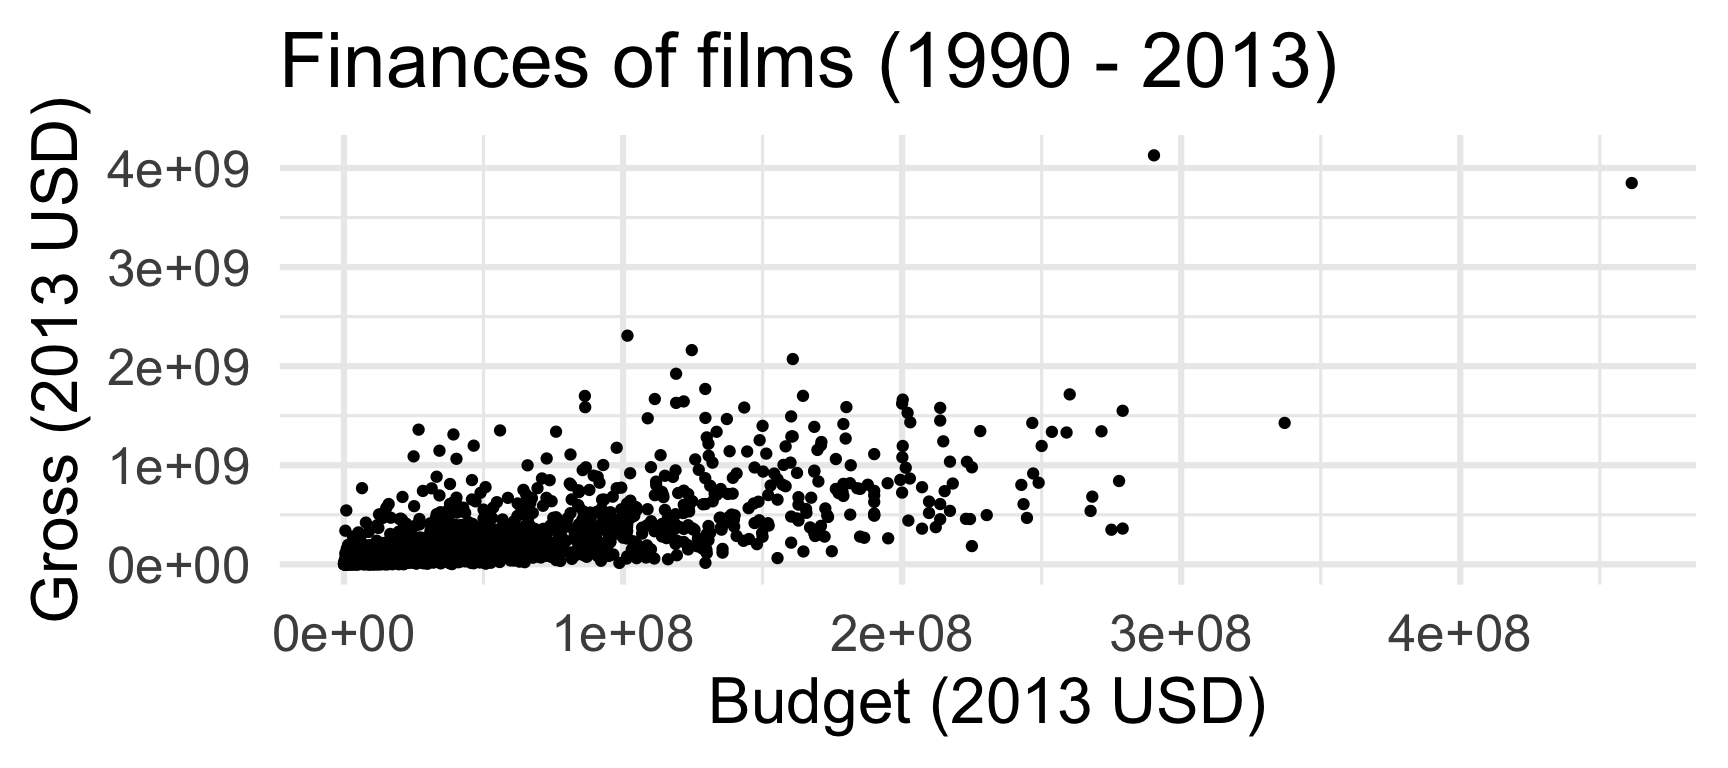
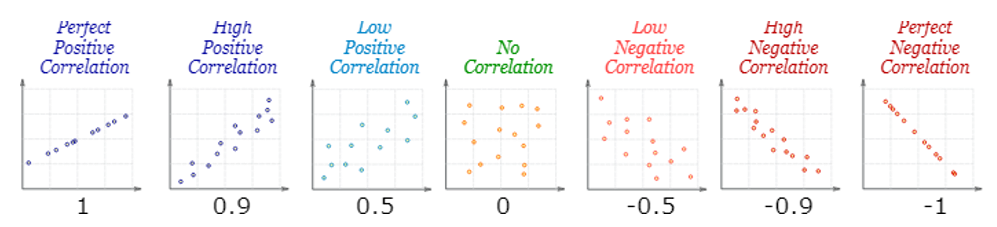
  • Direction: Positive or negative
  • Shape: Linear or nonlinear
  • Strength: How close are points to the “trend”

Strength and direction of linear relationships

Nonlinear relationships