Hello, World!
Lecture 1
August 26, 2025
Let’s do some data science!
Yesterday we collected some data from you!
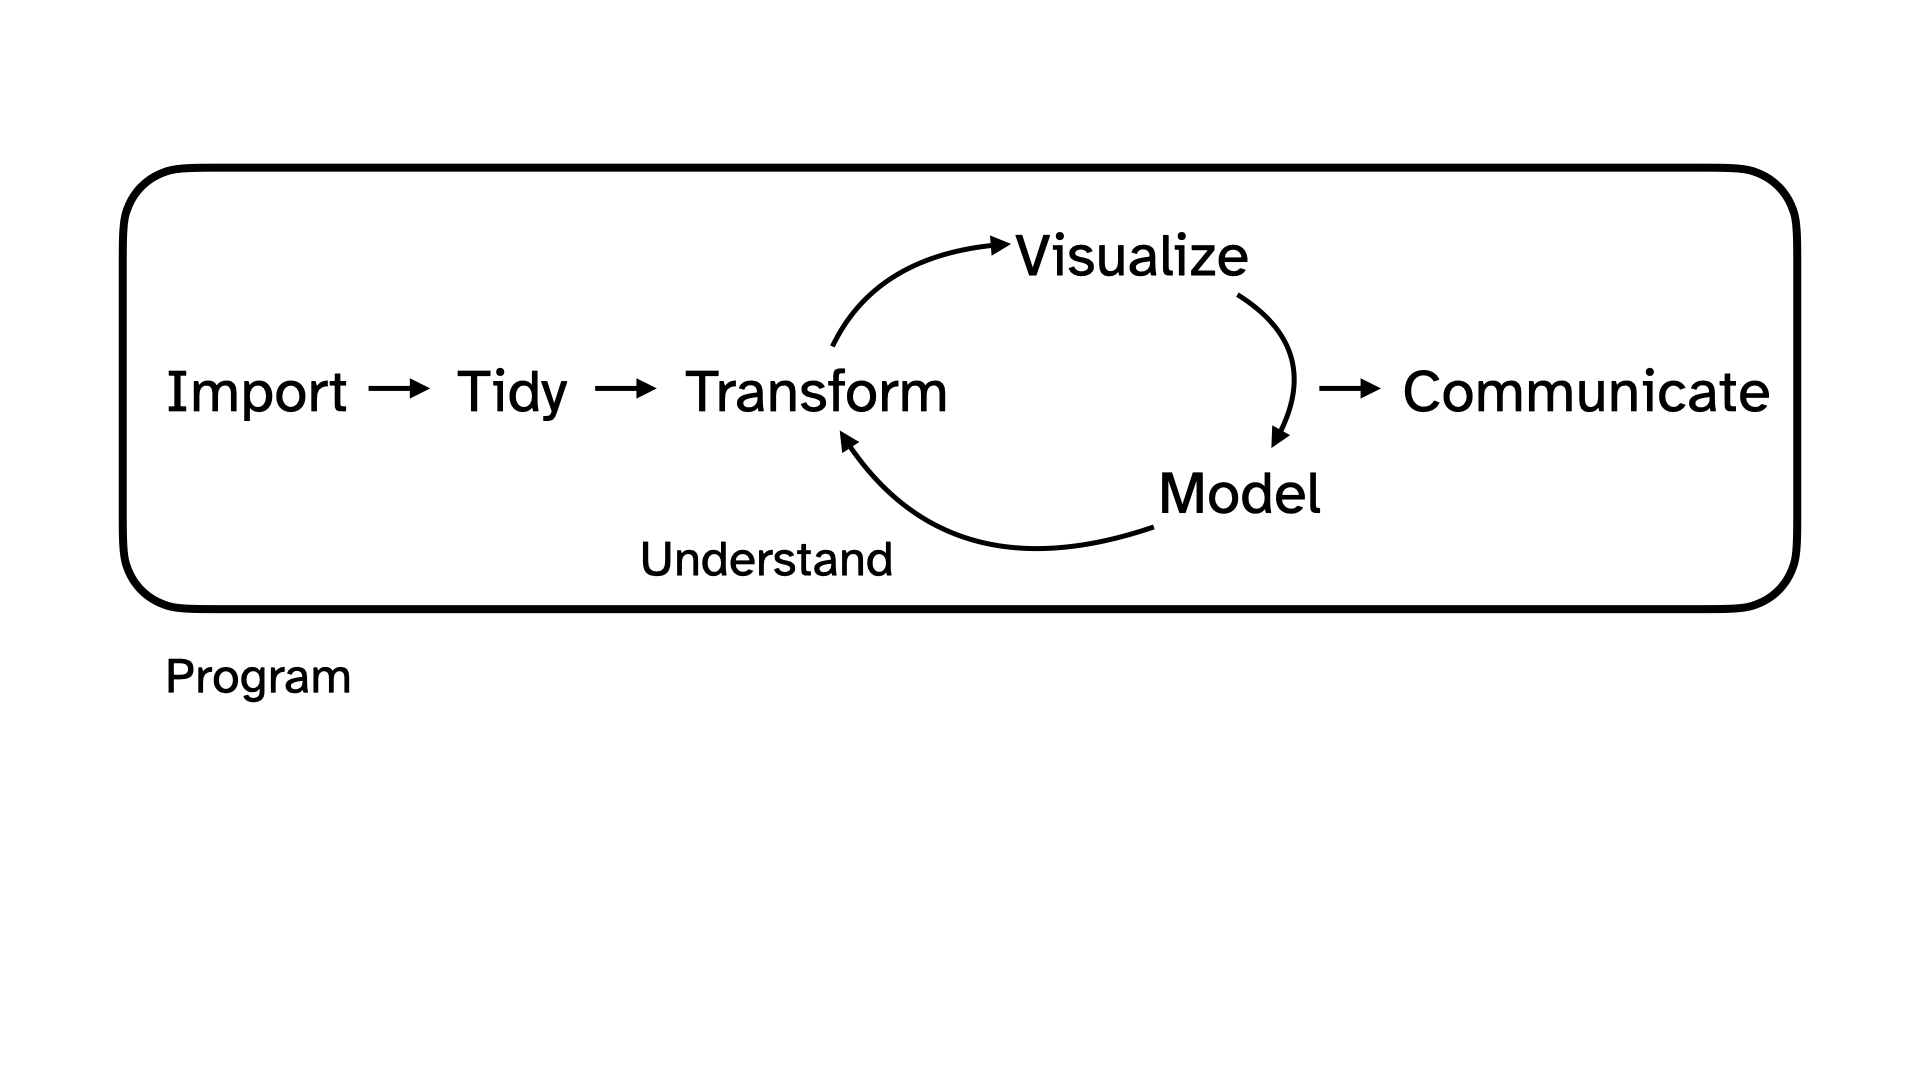
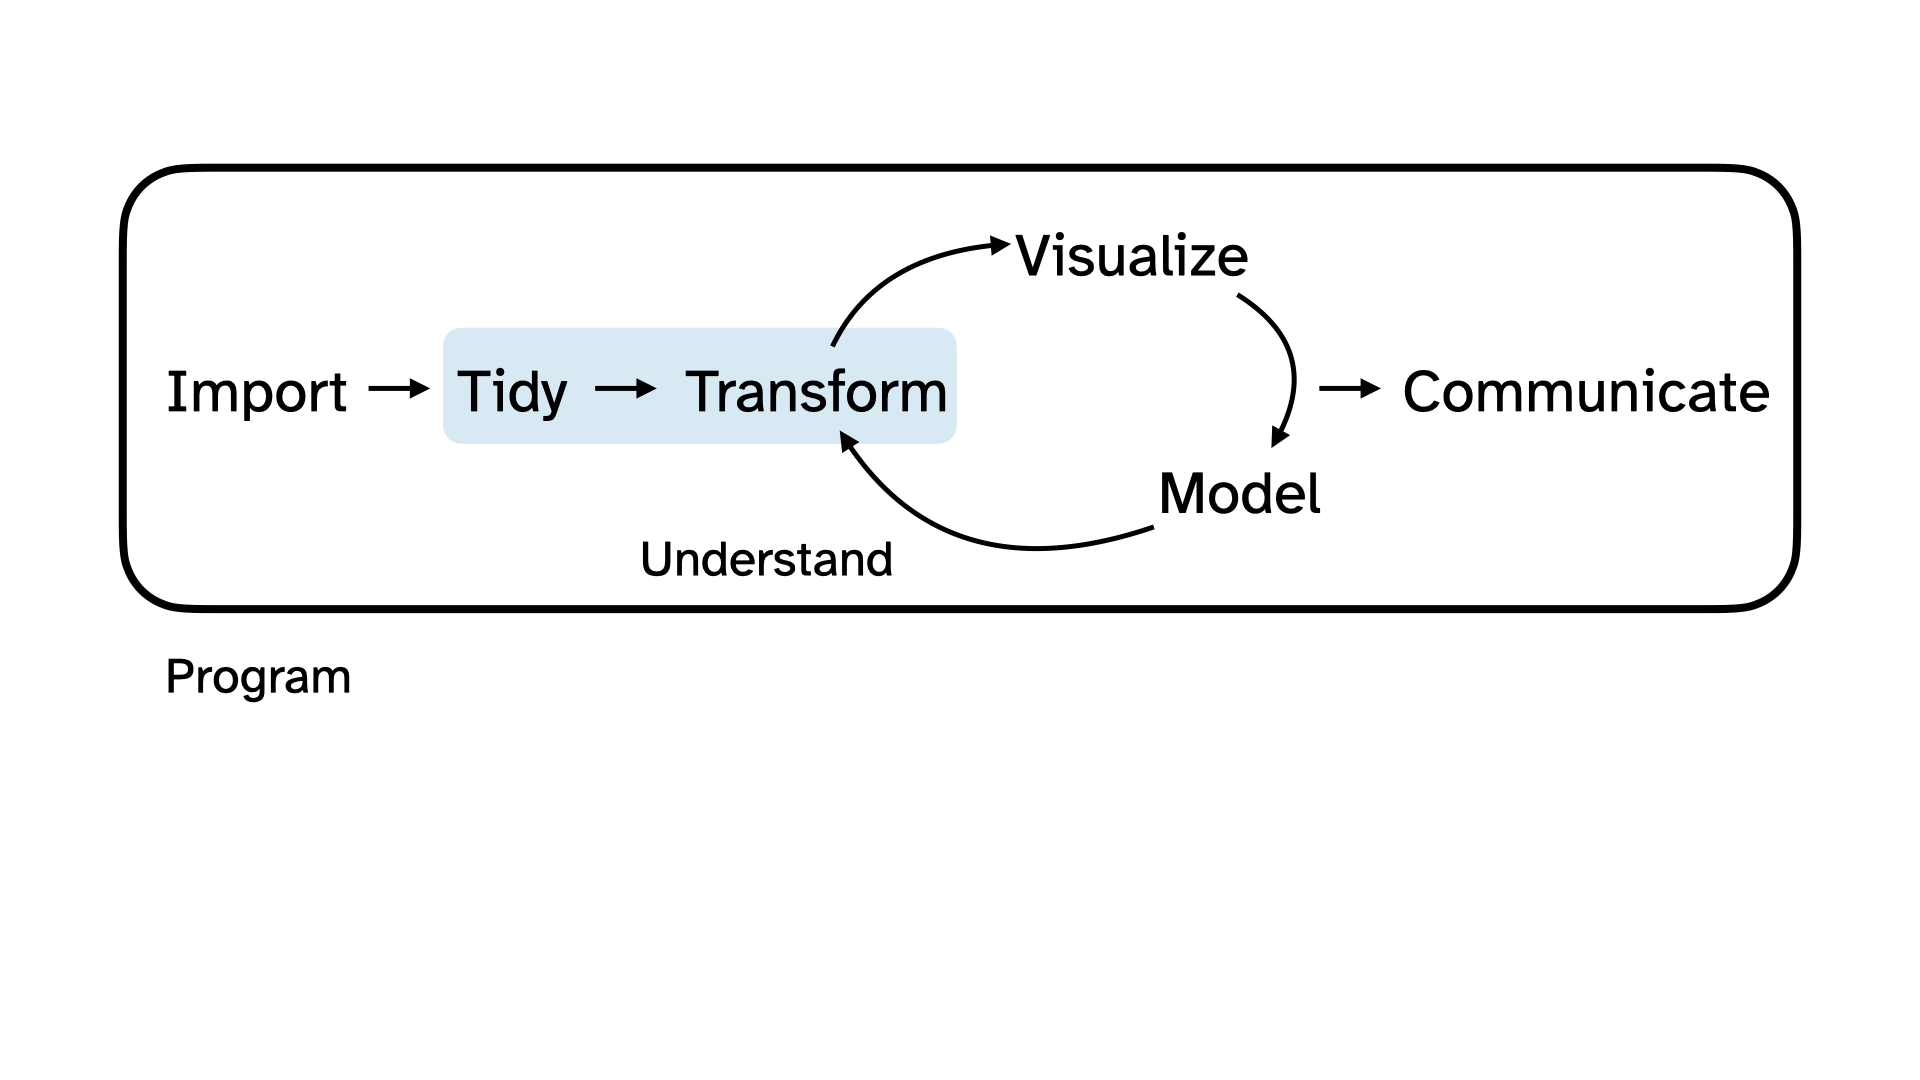
Today we’re going to explore that data together, following the data science cycle.
Warning
The data is anonymized and randomized and contains only a subset of the data collected. The rows have been shuffled for each column independently, meaning that no row belongs to a single student in the course. Additionally, any identifying information has been removed. Please do not try to de-anonymize or re-identify any individuals in the dataset.
Beginning the data science cycle
You took a survey:
Canvas stored your data in a CSV (comma-separated values) file:
We want to explore the data that is in that file!
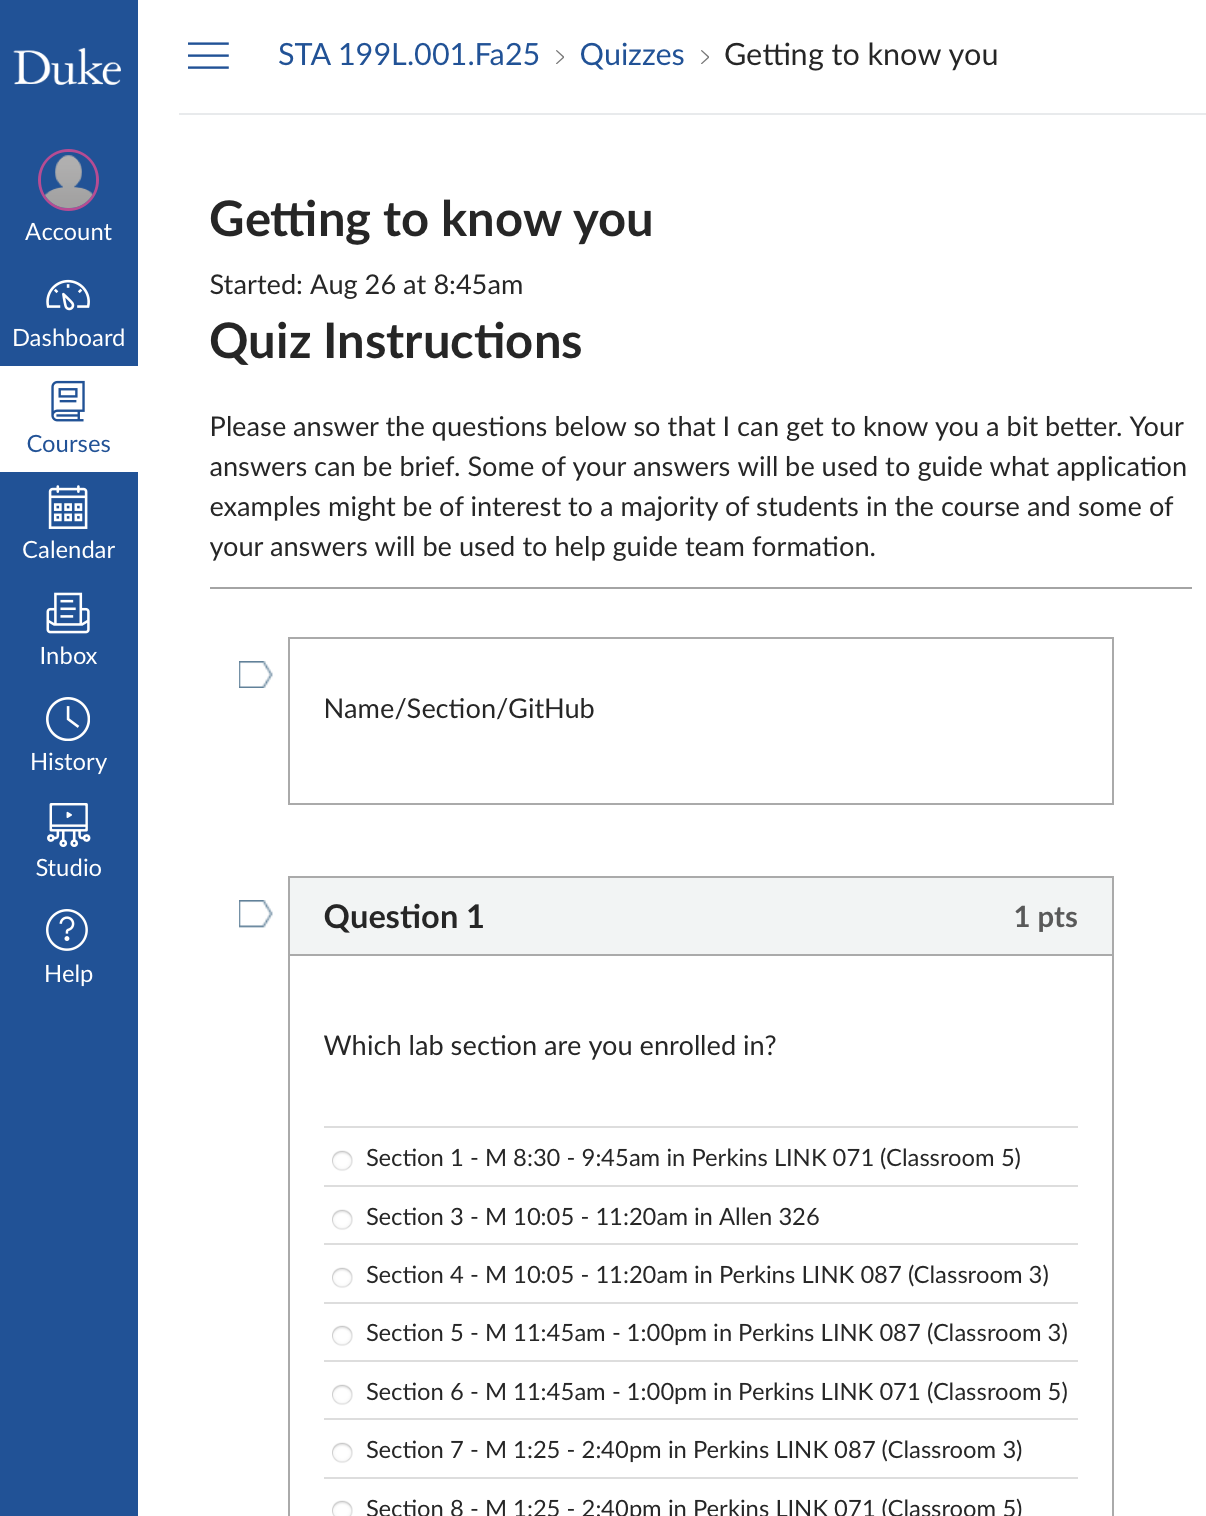
Import
Participate 💻📱

Scan the QR code or go to app.wooclap.com/sta199.
Log in with your Duke NetID.
Take a peek + Participate 💻📱
# A tibble: 230 × 5
   stats_experience       programming_experience programming_languages
   <chr>                  <chr>                  <chr>
 1 Yes, I have taken a h… A little — I’ve writt… "Java, Python, Yaml,…
 2 No, I have not taken … None                    <NA>
 3 Yes, I have taken a h… A little — I’ve writt…  <NA>
 4 No, I have not taken … Some — I’ve worked on…  <NA>
 5 No, I have not taken … Some — I’ve worked on…  <NA>
 6 No, I have not taken … A little — I’ve writt…  <NA>
 7 Yes, I have taken a h… None                   "Python and java"
 8 No, I have not taken … None                    <NA>
 9 Yes, I have taken a h… None                   "Python- a little bi…
10 Yes, I have taken a h… None                    <NA>
# ℹ 220 more rows
# ℹ 2 more variables: learn_best <chr>, data_interests <chr>
Scan the QR code or go to app.wooclap.com/sta199. Log in with your Duke NetID.
Visualize
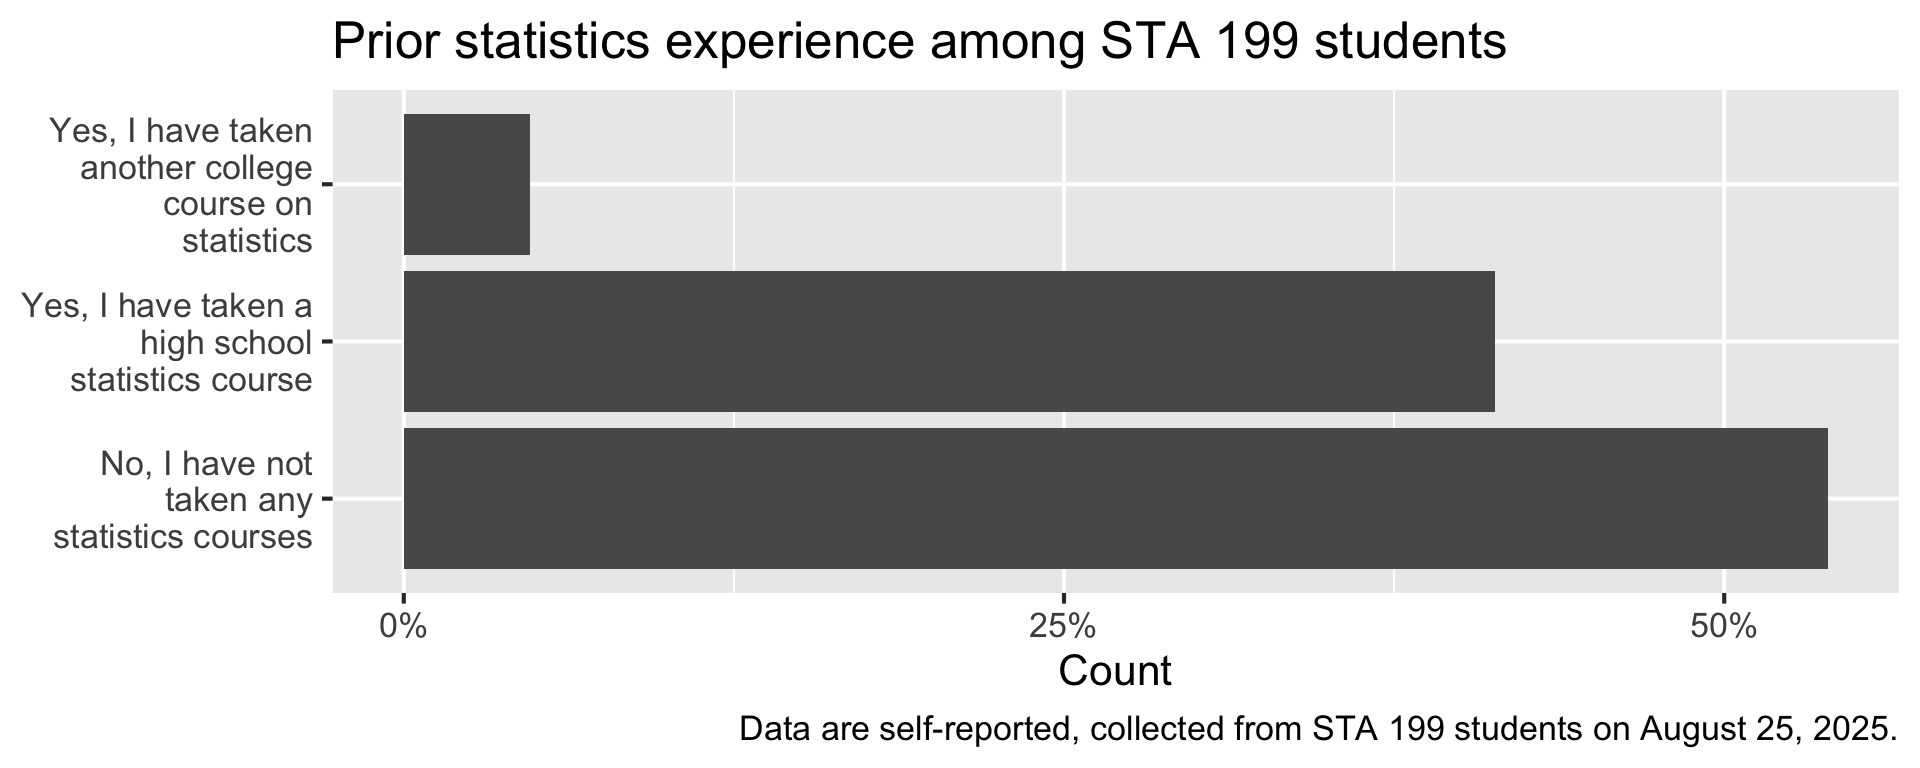
One way to make sense of data collected via a question like this is to visualize it.
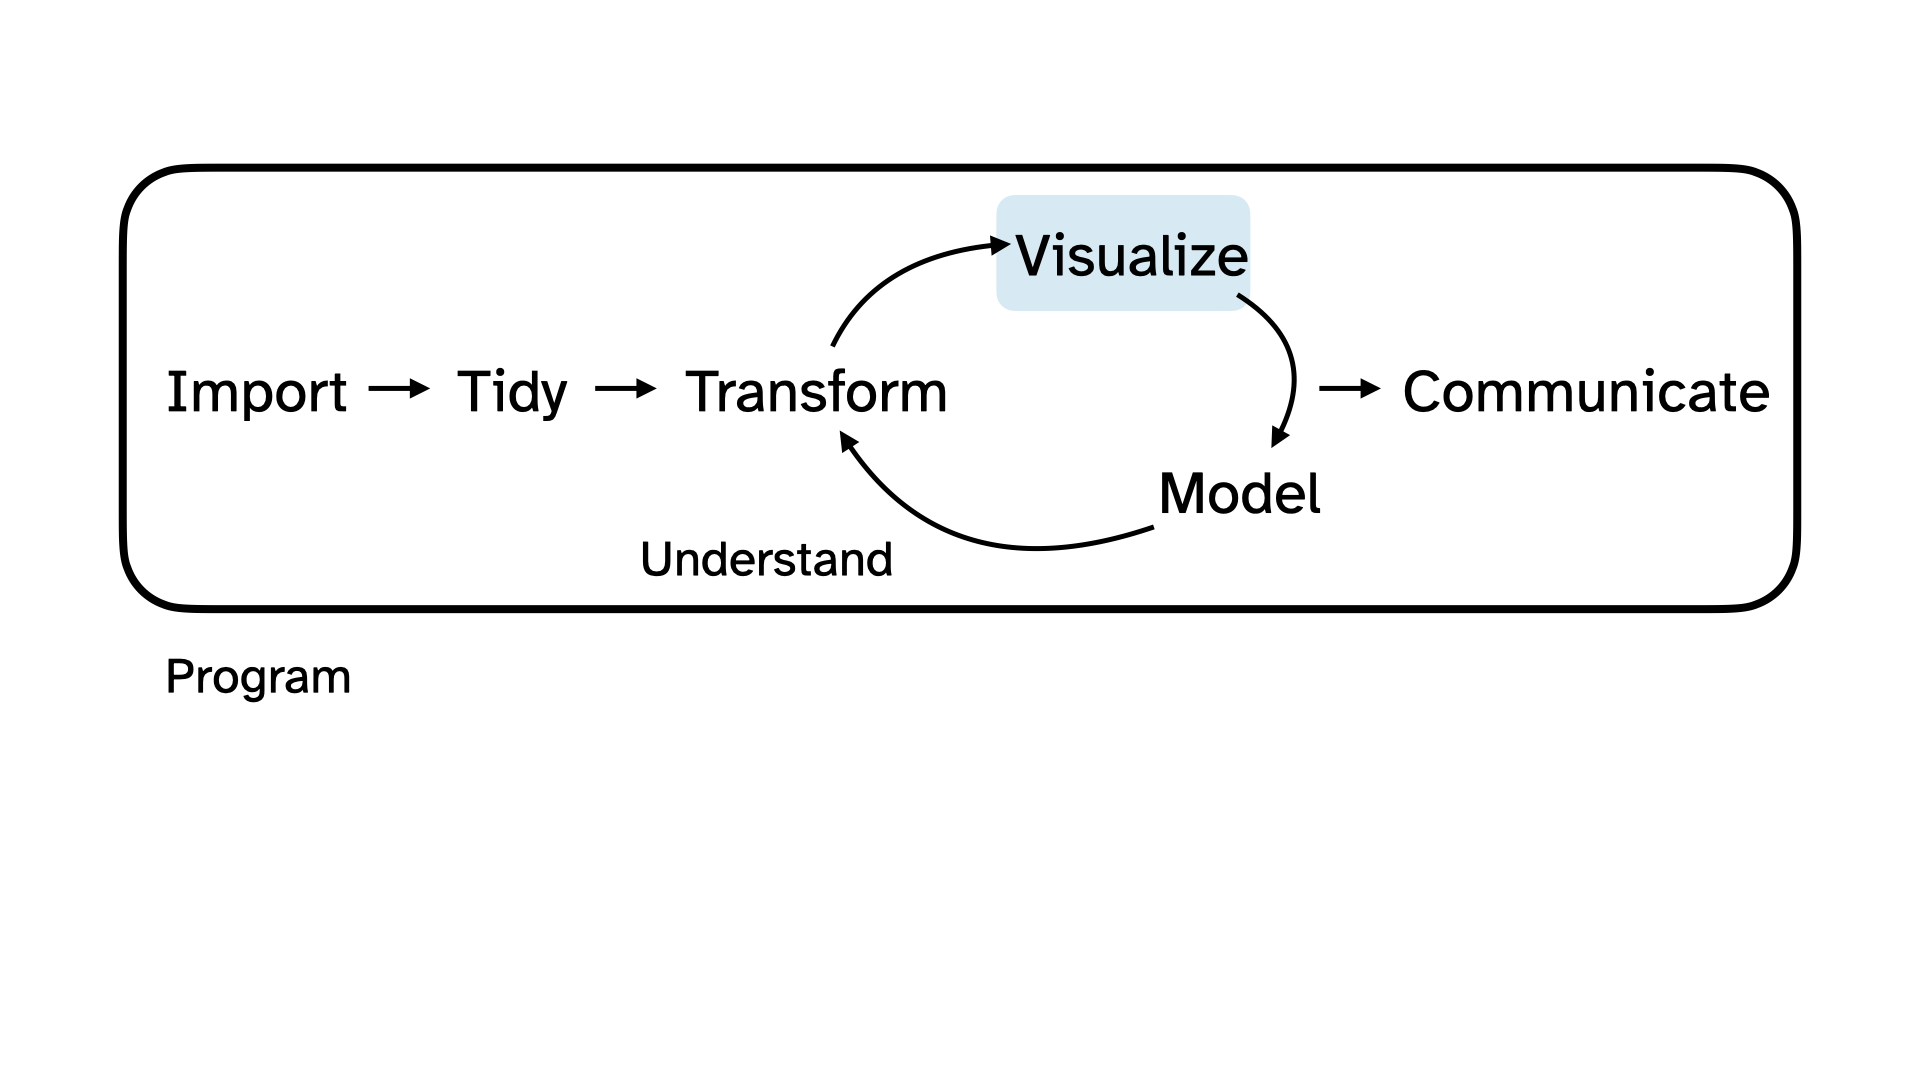
Visualize
Code
survey |>
  count(stats_experience) |>
  mutate(prop = n / sum(n)) |>
  ggplot(aes(y = stats_experience, x = prop))+
  geom_col(show.legend = FALSE) +
  scale_y_discrete(labels = label_wrap(20)) +
  scale_x_continuous(labels = percent_format(accuracy = 1), breaks = c(0, 0.25, 0.5)) +
  labs(
    title = "Prior statistics experience among STA 199 students",
    y = NULL,
    x = "Count"
  ) +
  labs(
    caption = "Data are self-reported, collected from STA 199 students on August 25, 2025."
  )
Visualize
Code
survey |>
  count(programming_experience) |>
  mutate(prop = n / sum(n)) |>
  ggplot(aes(y = fct_reorder(programming_experience, prop), x = prop, fill = prop))+
  geom_col(show.legend = FALSE) +
  scale_y_discrete(labels = label_wrap(25)) +
  scale_x_continuous(labels = percent_format(accuracy = 1), breaks = c(0, 0.1, 0.2, 0.3, 0.4)) +
  scale_fill_viridis_c(option = "E") +
  labs(
    title = "Prior programming experience among STA 199 students",
    y = NULL,
    x = "Count"
  ) +
  labs(
    caption = "Data are self-reported, collected from STA 199 students on August 25, 2025."
  ) +
  theme_minimal(base_size = 16)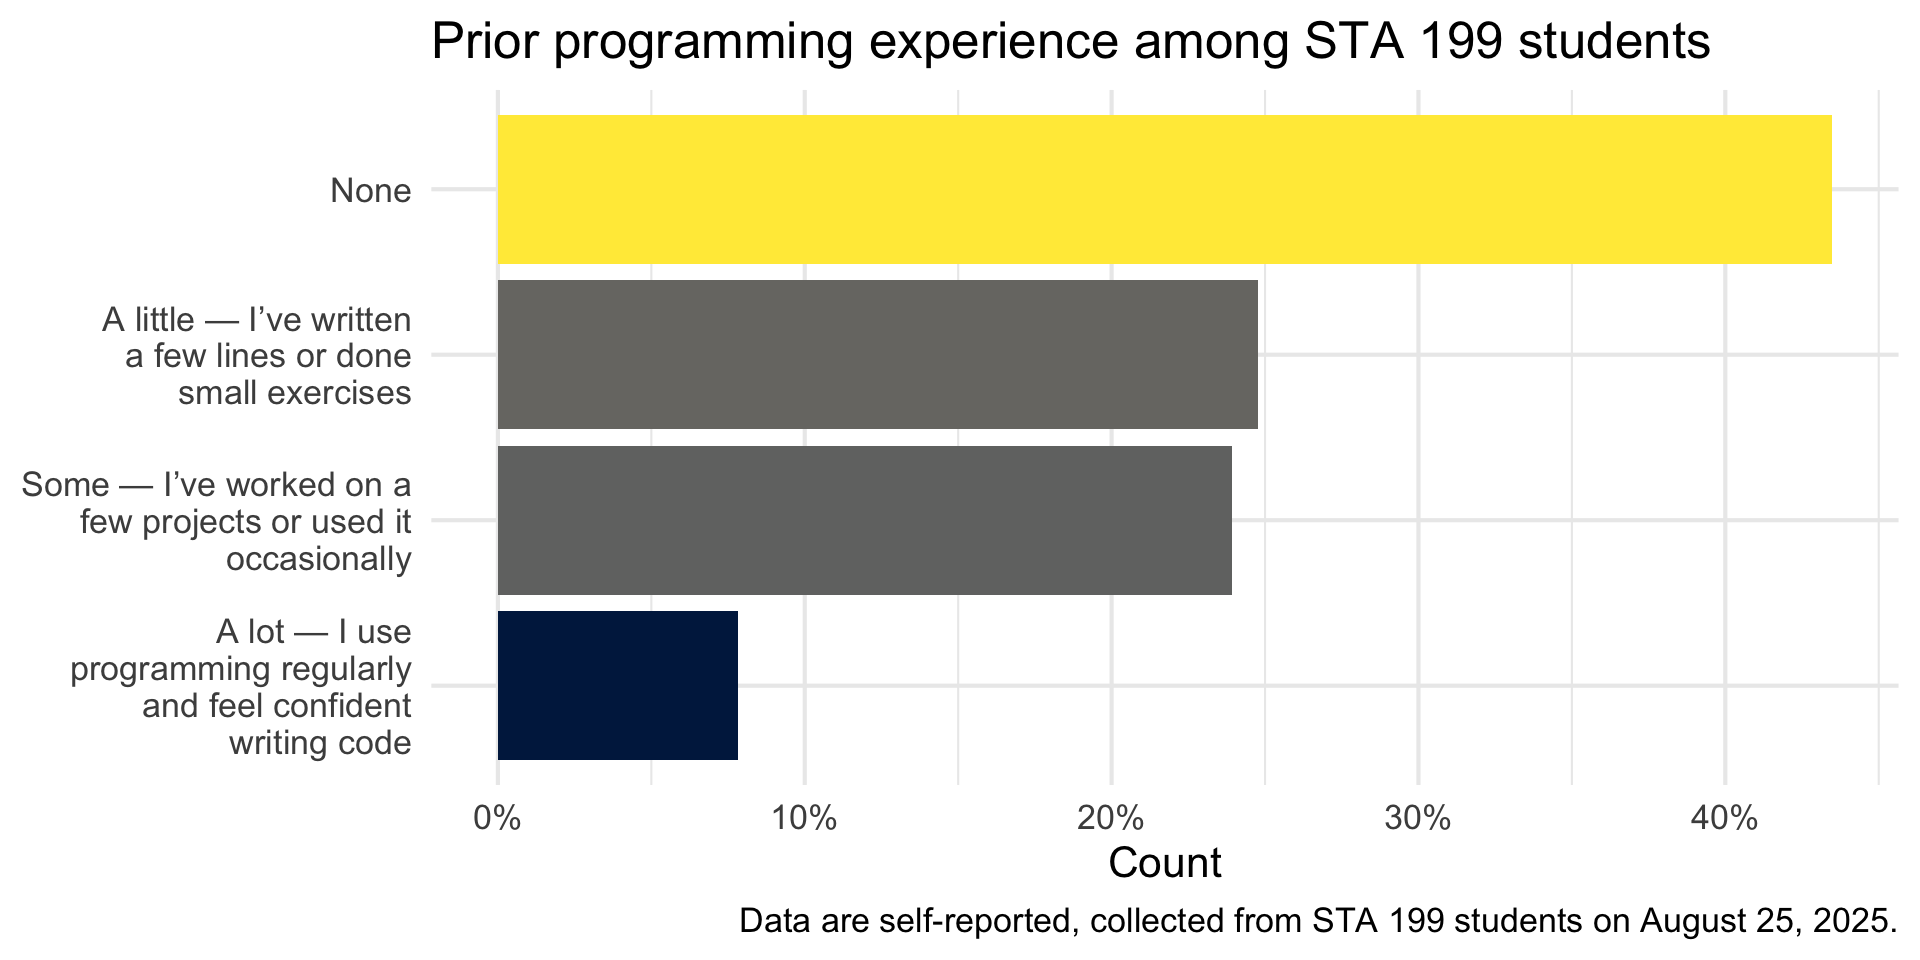
Tidy + Transform
Before we can visualize this variable, we need to tidy and transform it.
Visualize
Code
survey |>
  mutate(data_interests = str_remove_all(data_interests, "\\s*\\(.*?\\)")) |>
  separate_longer_delim(data_interests, delim = ",") |>
  count(data_interests, sort = TRUE) |>
  mutate(prop = n / sum(n)) |>
  filter(!is.na(data_interests)) |>
  ggplot(aes(y = fct_reorder(data_interests, prop), x = prop, fill = prop)) +
  geom_col(show.legend = FALSE) +
  scale_y_discrete(labels = label_wrap(20)) +
  scale_x_continuous(labels = percent_format(accuracy = 1)) +
  scale_fill_taylor_c(album = "Speak Now") +
  labs(
    title = "Data interests among STA 199 students",
    y = NULL,
    x = "Count",
    caption = "Data are self-reported, collected from STA 199 students on August 25, 2025."
  ) +
  theme_minimal(base_size = 16)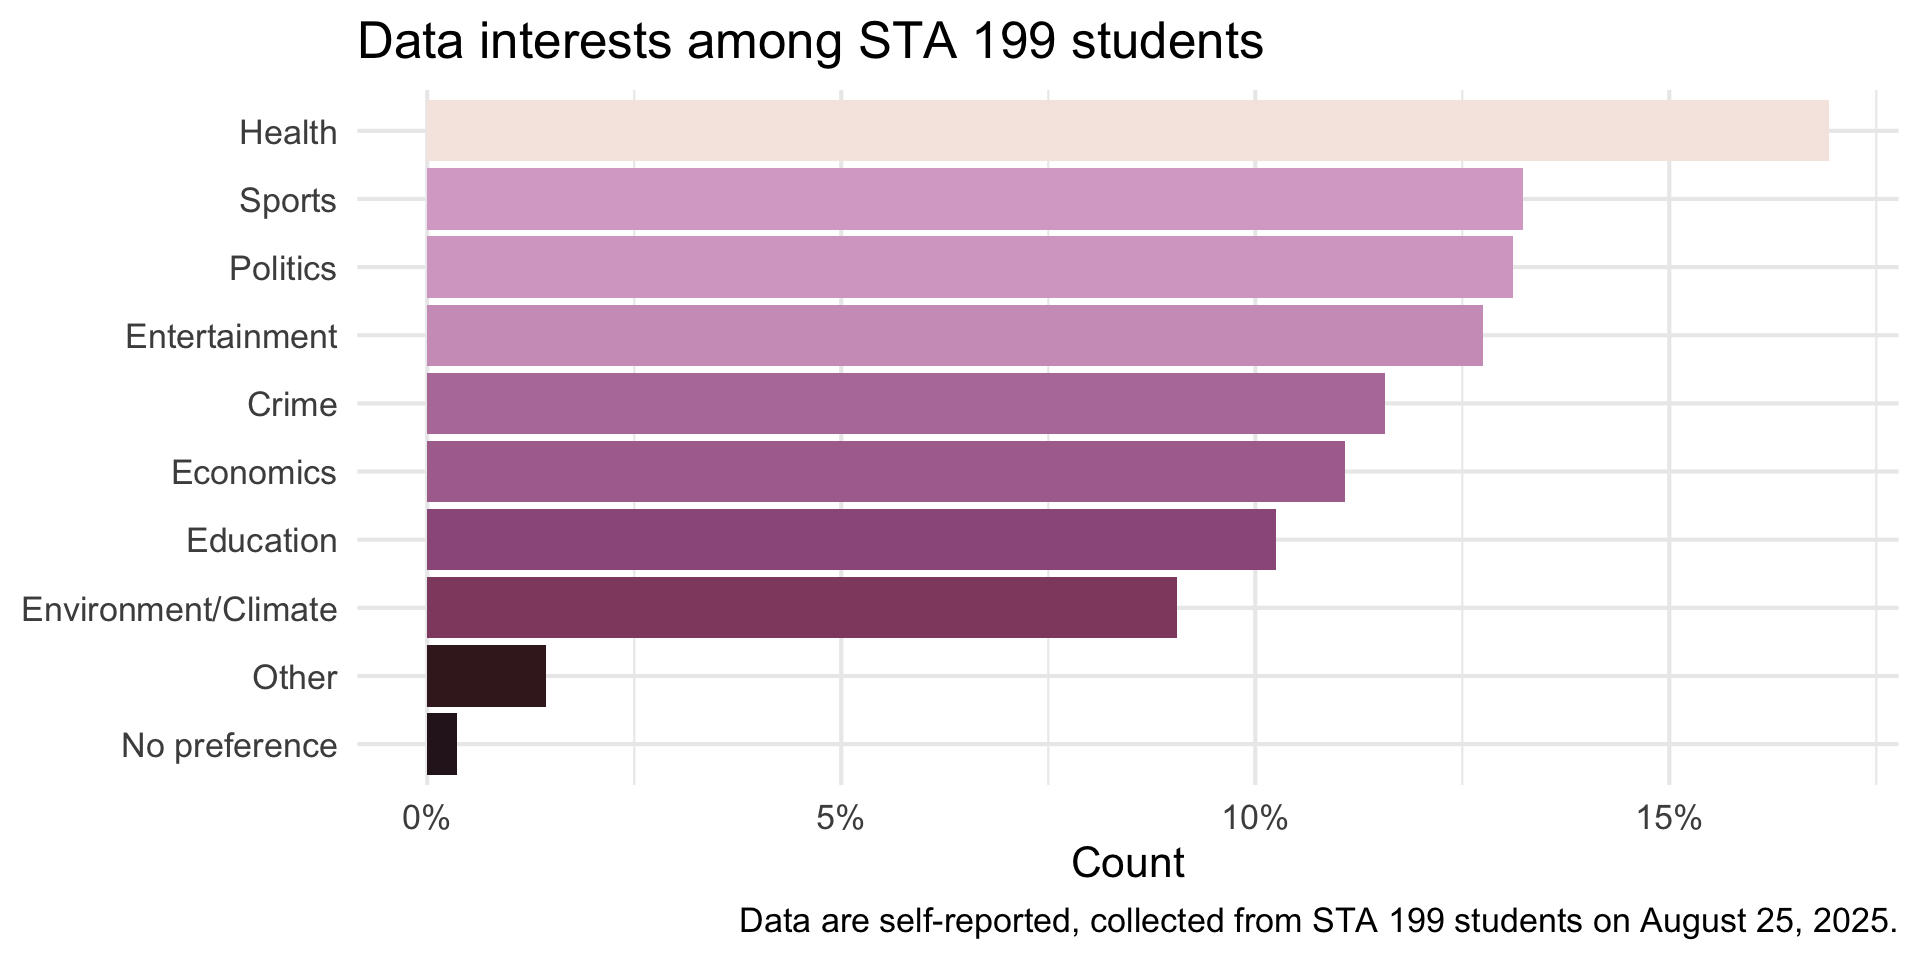
Take a peek + Participate 💻📱
And the answers are non-trivial to tidy up, e.g.,
- Python - I've used it very little.
- I have not programmed before.
- Java - very comfortable. Python - pretty comfortable. C/C++ - not super comfortable, haven't used since high school.
Scan the QR code or go to app.wooclap.com/sta199. Log in with your Duke NetID.
Participate 💻📱
Scan the QR code or go to app.wooclap.com/sta199.
Log in with your Duke NetID.