Lab 6
#canceled
Introduction
In this lab you’ll will work with hotel cancellations. The data describe the demand of two different types of hotels. Each observation represents a hotel booking between July 1, 2015 and August 31, 2017. Some bookings were cancelled (is_canceled = 1) and others were kept, i.e., the guests checked into the hotel (is_canceled = 0). You can view the code book for all variables here.
Getting started
By now you should be familiar with how to get started with a lab assignment by cloning the GitHub repo for the assignment. If you’re not sure how, refer back to an earlier lab.
Open the lab-6.qmd template Quarto file and update the authors field to add your name first (first and last) and then your teammates’ names (first and last). Render the document. Examine the rendered document and make sure your and your teammates’ names are updated in the document. Commit and push your changes with a meaningful commit message and push to GitHub.
Click to expand if you need a refresher on assignment guidelines.
Code
Code should follow the tidyverse style. Particularly,
- there should be spaces before and line breaks after each
+when building aggplot, - there should also be spaces before and line breaks after each
|>in a data transformation pipeline, - code should be properly indented,
- there should be spaces around
=signs and spaces after commas.
Additionally, all code should be visible in the PDF output, i.e., should not run off the page on the PDF. Long lines that run off the page should be split across multiple lines with line breaks.1
Plots
- Plots should have an informative title and, if needed, also a subtitle.
- Axes and legends should be labeled with both the variable name and its units (if applicable).
- Careful consideration should be given to aesthetic choices.
Workflow
Continuing to develop a sound workflow for reproducible data analysis is important as you complete the lab and other assignments in this course.
- You should have at least 3 commits with meaningful commit messages by the end of the assignment.
- Final versions of both your
.qmdfile and the rendered PDF should be pushed to GitHub.
Packages
In this lab we will work with the tidyverse package.
Data
The dataset, called hotels.csv, can be found in the data folder.
hotels <- read_csv("data/hotels.csv")Below is an exploratory summary of the variables in the dataset we will use in our analysis.
| Cancellation status | Number of bookings |
|---|---|
| 0 - Not canceled | 75166 |
| 1 - Canceled | 44224 |
| Number of adults | Number of bookings |
|---|---|
| 0 | 403 |
| 1 | 23027 |
| 2 | 89680 |
| 3 | 6202 |
| 4 | 62 |
| 5 | 2 |
| 6 | 1 |
| 10 | 1 |
| 20 | 2 |
| 26 | 5 |
| 27 | 2 |
| 40 | 1 |
| 50 | 1 |
| 55 | 1 |
Questions
Part 1 - Data prep
Question 1
- One of the outcome variables you’ll use is
is_canceled. Transform this variable to the appropriate data class so that- it uses informative labels (“not canceled” and “canceled” instead of 0 and 1, respectively), and
- the levels are ordered such that when we fit a logistic regression model to predict this outcome, success is defined as “canceled” (what we’re predicting)
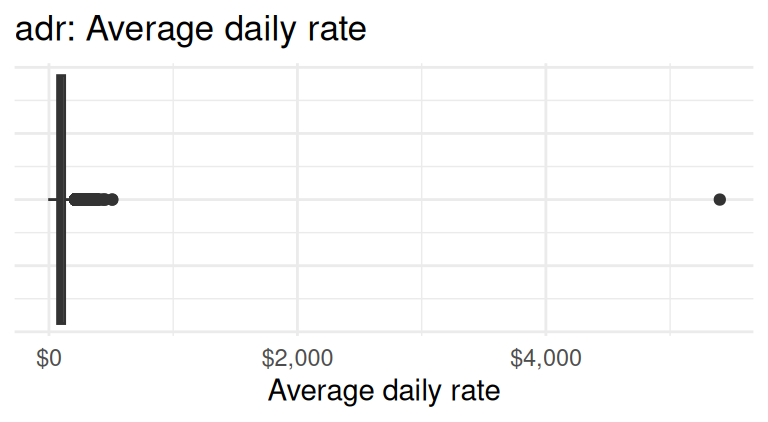
- Based on the exploratory summaries above, you should address a few data quality issues before moving forward with the analysis. To do so, filter the dataset to remove
- any bookings with average daily rate greater than $1,000 and
- any bookings with number of adults greater than or equal to 5.
- Split the data into a training set (75%) and a testing set (25%), setting the random seed to
1117for reproducibility.
Part 2 - Predicting cancellations
Question 2
Using these data, one of our goals is to explore the following question:
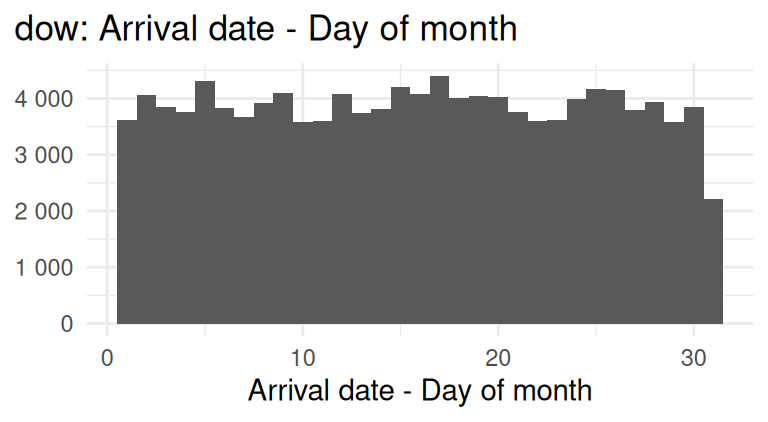
Are reservations earlier in the month or later in the month more likely to be cancelled?
- In a single pipeline, calculate the mean arrival dates (
arrival_date_day_of_month) for reservations that were cancelled and reservations that were not cancelled.
Think carefully about which dataset you should use: hotels, the training subset, or the testing subset?
In your own words, explain why we can not use a linear model to model the relationship between if a hotel reservation was cancelled and the day of month for the booking.
Fit the appropriate model to predict whether a reservation was cancelled from
arrival_date_day_of_monthand display a tidy summary of the model output. Then, interpret the slope coefficient in context of the data and the research question.
The slope interpretation will have the following format:
The model predicts that, for each day the booking is ___ (later / earlier) in the month, the ___ (chance / probability / odds) of a hotel cancellation is ___ (lower / higher) by a factor of ___, on average.
- Calculate the probability that the hotel reservation is cancelled if it the arrival date is on the 17th of the month. Based on this probability, would you predict this booking would be cancelled or not cancelled. Explain your reasoning for your classification.
Question 3
Fit another model to predict whether a reservation was cancelled from
arrival_date_day_of_monthandhoteltype (Resort or City Hotel), allowing the relationship betweenarrival_date_day_of_monthandis_canceledto vary based onhoteltype. Display a tidy output of the model.Interpret the intercept in context of the data.
Part 3 - Predicting daily rates
Question 4
The dataset also contains information about the average daily rate (adr) for each reservation. The following model predicts adr from adults and hotel type.
# A tibble: 3 × 5
  term              estimate std.error statistic   p.value
  <chr>                <dbl>     <dbl>     <dbl>     <dbl>
1 (Intercept)           50.5     0.605      83.5 0
2 adults                29.5     0.311      94.9 0
3 hotelResort Hotel -10.7 0.322 -33.1 2.48e-239-
Which of the following is the best interpretation of the slope coefficient for
adults?For each additional adult in the booking, the average daily rate is predicted to be higher by $29.50
A. on average, holding hotel type constant.
B. for Resort Hotels compared to City Hotels, on average.
C. for City Hotels compared to Resort Hotels, on average.
D. on average, not holding any other variables constant.
-
Which of the following is the correct interpretation of the slope coefficient for
hotel?A. For each additional Resort Hotel booking, the predicted average daily rate is $10.70 lower, holding number of adults constant.
B. For each additional adult in the booking, the average daily rate is predicted to be lower by $10.70 for resort hotels compared to City Hotels, on average.
C. Resort Hotels bookings are predicted to have an average daily rate that is $10.70 lower than City Hotels, on average, holding number of adults constant.
D. Resort Hotels bookings are predicted to have an average daily rate that is $10.70 higher than City Hotels, on average, holding number of adults constant.
-
Which of the following is the correct interpretation of the intercept?
A. The predicted average daily rate for a bookings with 0 adults at a Resort Hotel is $50.50, on average.
B. The predicted average daily rate for a bookings with 0 adults at a City Hotel is $50.50, on average.
C. For each additional adult and Resort Hotel in the booking, the average daily rate is predicted to be $50.50 higher, on average.
D. For each additional adult and City Hotel in the booking, the average daily rate is predicted to be $50.50 higher, on average.
Which of the following (Plot A or Plot B) is the correct visual representation of this model?
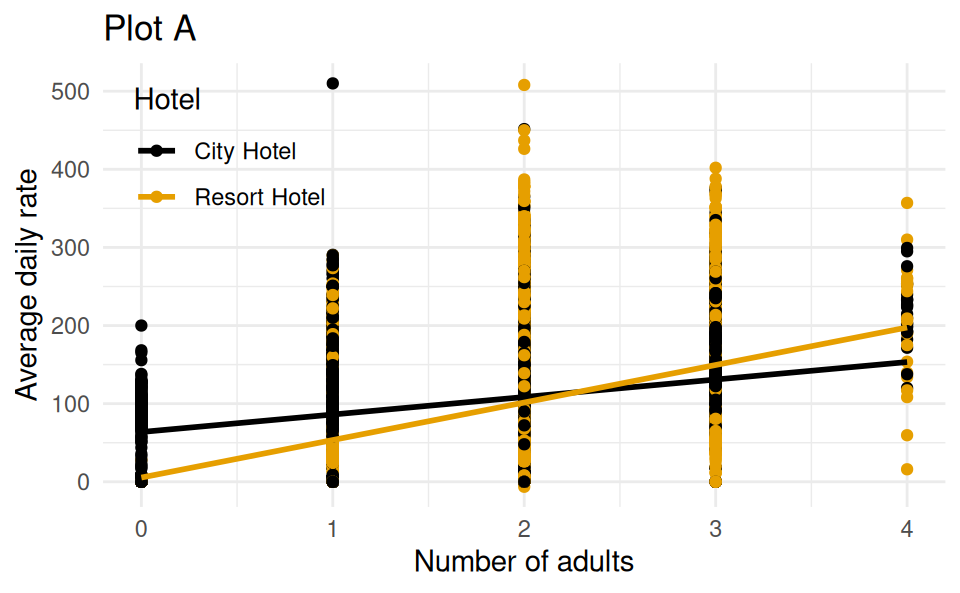
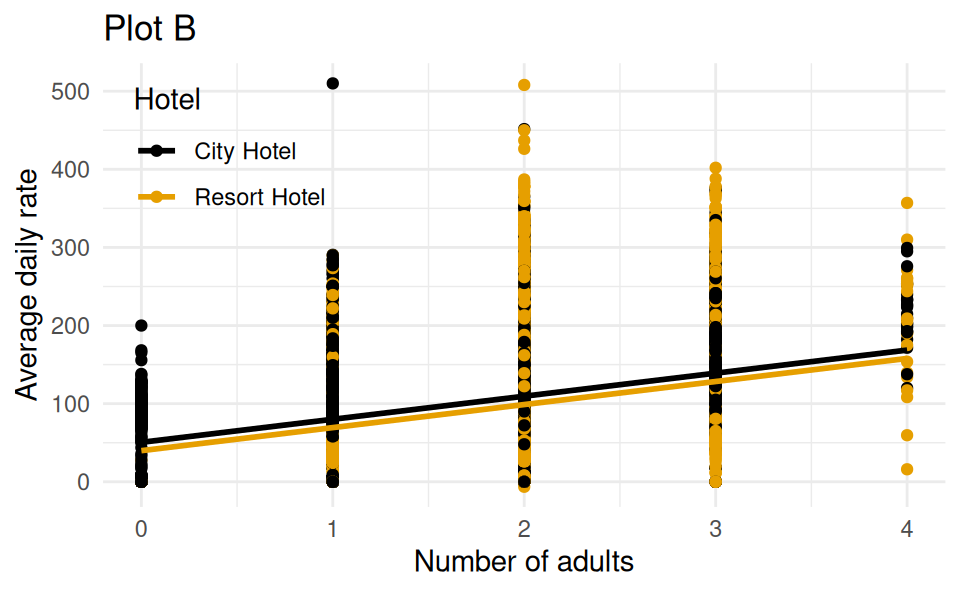
Think about whether you should include only main effects of adults and hotel or also their interaction effect as well in your model in order to match the plot.
If you were to continue this analysis, you could evaluate the model performance on the testing set. You could also explore including other predictors in the model to see if they improve model performance.
Wrap-up
Before you wrap up the assignment, make sure that you render, commit, and push one final time so that the final versions of both your .qmd file and the rendered PDF are pushed to GitHub and your Git pane is empty. We will be checking these to make sure you have been practicing how to commit and push changes.
Submission
By now you should also be familiar with how to submit your assignment in Gradescope.
Click to expand if you need a refresher on how to get started with a lab assignment.
Submit your PDF document to Gradescope by the end of the lab to be considered “on time”:
- Go to http://www.gradescope.com and click Log in in the top right corner.
- Click School Credentials \(\rightarrow\) Duke NetID and log in using your NetID credentials.
- Click on your STA 199 course.
- Click on the assignment, and you’ll be prompted to submit it.
- Mark all the pages associated with question. All the pages of your lab should be associated with at least one question (i.e., should be “checked”).
Make sure you have:
- attempted all questions
- rendered your Quarto document
- committed and pushed everything to your GitHub repository such that the Git pane in RStudio is empty
- uploaded your PDF to Gradescope
Grading and feedback
- This lab is worth 30 points:
- 10 points for being in lab and turning in something – no partial credit for this part.
- 20 points for:
- answering the questions correctly – there is partial credit for this part.
- following the workflow – there is partial credit for this part.
- The workflow points are for:
- committing at least three times as you work through your lab,
- having your final version of
.qmdand.pdffiles in your GitHub repository, and - overall organization.
- You’ll receive feedback on your lab on Gradescope within a week.
Good luck, and have fun with it!
Footnotes
Remember, haikus not novellas when writing code!↩︎