AE 08: Age gaps + import
Suggested answers
These are suggested answers. This document should be used as a reference only; it’s not designed to be an exhaustive key.
Packages
We will use the following two packages in this application exercise.
- tidyverse: For data import, wrangling, and visualization.
- readxl: For importing data from Excel.
Data
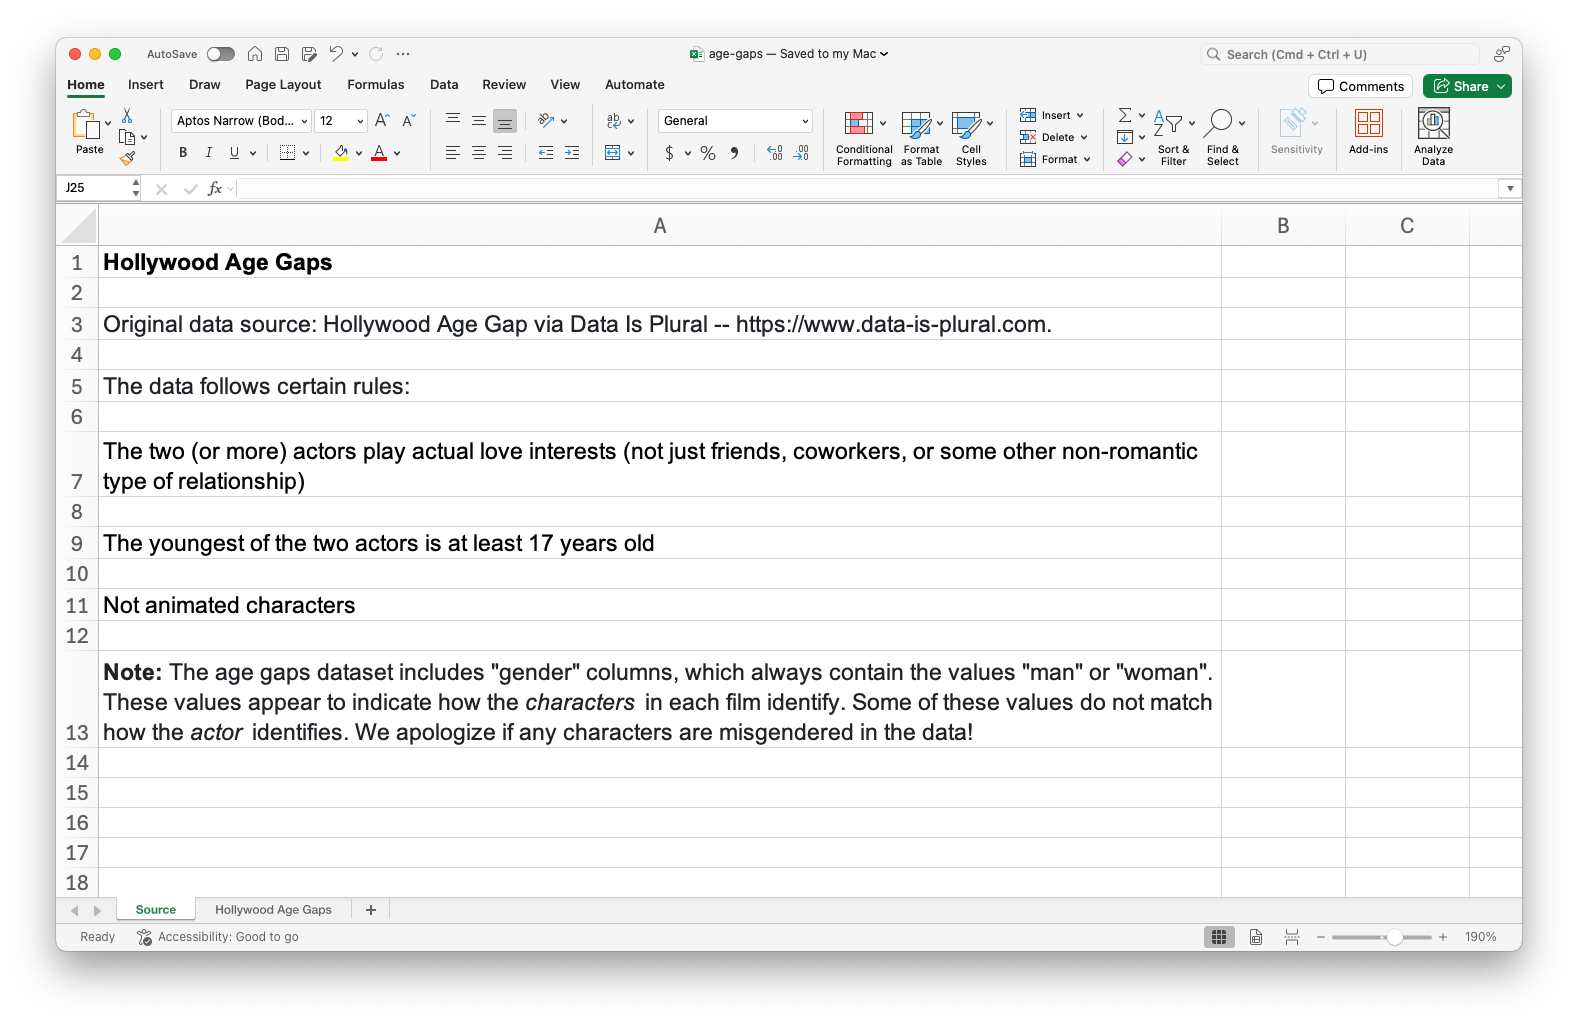
The data for this application exercise is from Data is Plural and it is on age gaps in Hollywood relationships.
The data follows certain rules:
- The two (or more) actors play actual love interests (not just friends, coworkers, or some other non-romantic type of relationship).
- The youngest of the two actors is at least 17 years old.
- Not animated characters.
The age gaps dataset includes “gender” columns, which always contain the values “man” or “woman”. These values appear to indicate how the characters in each film identify. Some of these values do not match how the actor identifies.
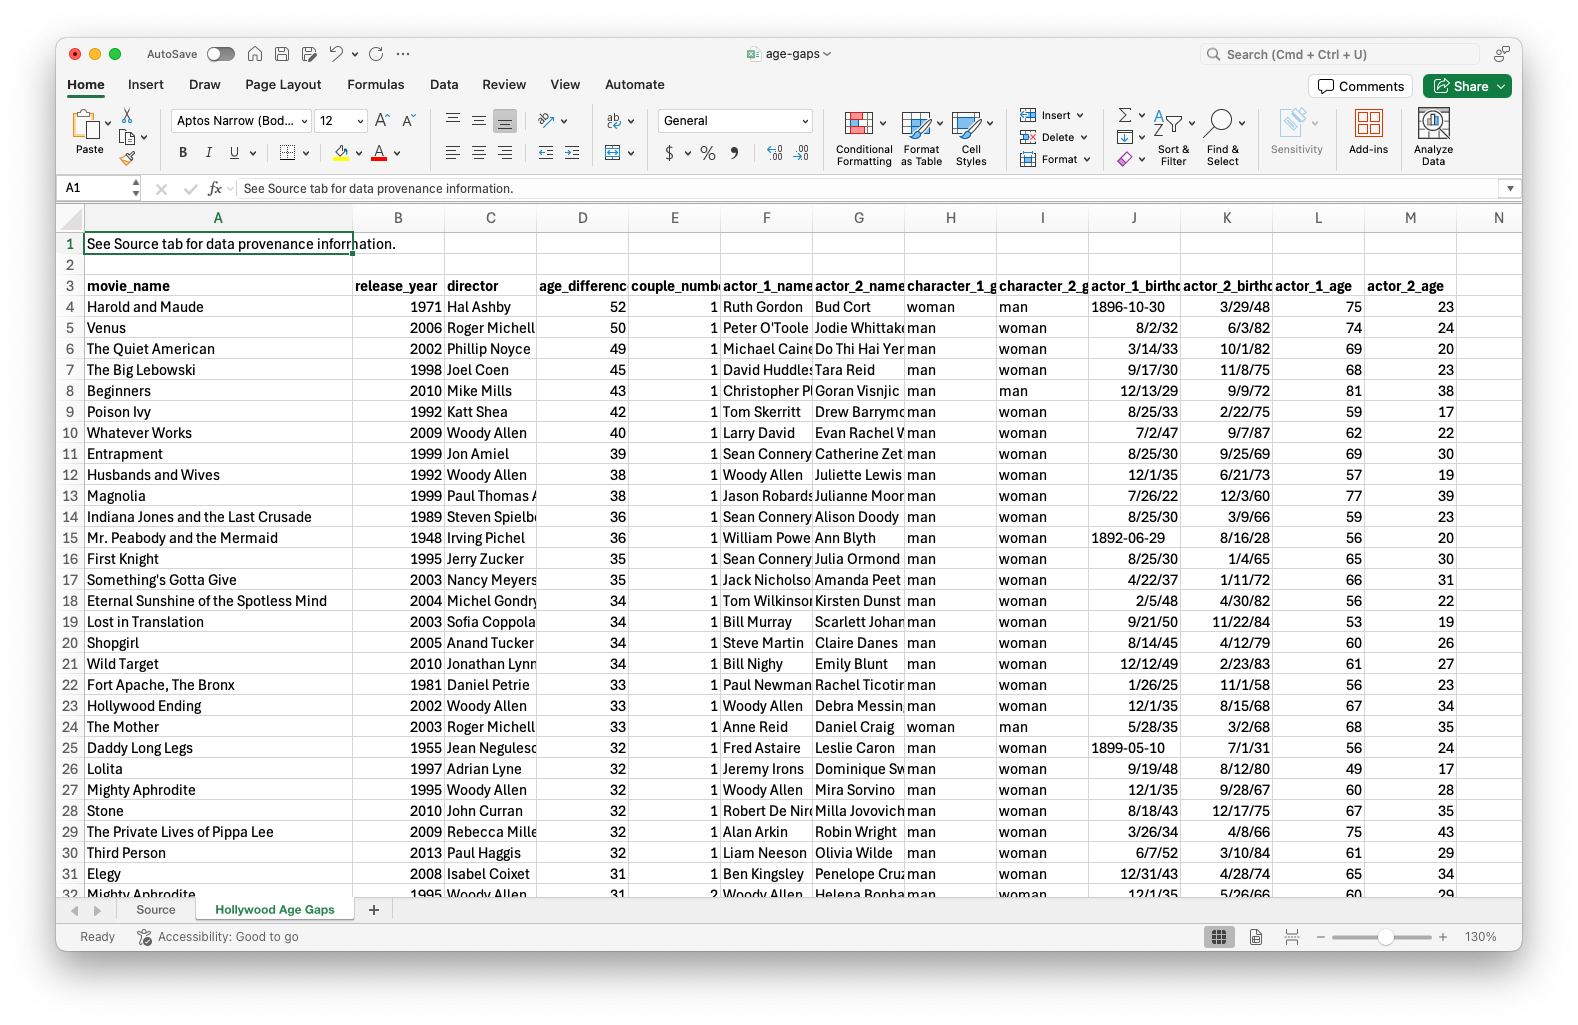
The data are in an Excel file called age-gaps.xlsx in your data folder.
This is how the Excel file looks – it has two sheets, one with the data (called Hollywood Age Gaps) and one with information about the data (called Source). Additionally, the data sheet has some metadata at the top, above the column headers.
Import
Load the data from age-gaps.xlsx in your data and assign it to age_gaps. Confirm that this new object appears in your Environment tab. Click on the name of the object in your Environment tab to pop open the data in the data viewer.
age_gaps <- read_excel(
  "data/age-gaps.xlsx",
  sheet = "Hollywood Age Gaps",
  skip = 2
)
Subset
Create a subset of the data frame for heterosexual relationships on screen.
age_gaps_heterosexual <- age_gaps |>
  filter(character_1_gender != character_2_gender)
Split the data for heterosexual relationships into three – where woman is older, where man is older, where they are the same age. Save these subsets as two appropriately named data frames. Remember: Use concise and evocative names. Confirm that these new objects appear in your Environment tab and that the sum of the number of observations in the two new data frames add to the number of observations in the original data frame.
age_gaps_heterosexual <- age_gaps_heterosexual |>
  mutate(
    older = case_when(
      character_1_gender == "woman" & actor_1_age > actor_2_age ~ "woman older",
      character_2_gender == "woman" & actor_2_age > actor_1_age ~ "woman older",
      character_1_gender == "man" & actor_1_age > actor_2_age ~ "man older",
      character_2_gender == "man" & actor_2_age > actor_1_age ~ "man older",
      actor_1_age == actor_2_age ~ "same age"
    )
  )

woman_older <- age_gaps_heterosexual |> filter(older == "woman older")
man_older <- age_gaps_heterosexual |> filter(older == "man older")
same_age <- age_gaps_heterosexual |> filter(older == "same age")

(nrow(woman_older) + nrow(man_older) + nrow(same_age)) ==
  nrow(age_gaps_heterosexual)
[1] TRUEExport
Write out the three new datasets you created into the data, and within that, into a subfolder called age-gaps-subsets, as CSV files.